JAPANESE / ENGLISH
JAPANESE / ENGLISH
link FiberLabs’ new flagship PDFA and BDFA for O-band WDM signal amplification
With the growing importance of AI and cloud computing, demand for energy-efficient data center interconnect is increasing rapidly. Connecting data centers with O-band optics reduces power consumption arising from dispersion compensation, as the standard single-mode fiber shows its zero dispersion in the O-band. Now the O-band is the primary wavelength for high-speed ethernet, co-packaged optics, optical I/O for AI, High Performance Computing (HPC) and disaggregated computing.
These applications typically use WDM transmission in the O-band, and several WDM grids are defined as industry standards, for example, CWDM4, LAN-WDM4, LAN-WDM8, CW-WDM (18-nm and 36-nm span). O-band optical amplifiers are key to this O-band WDM ecosystem, as they allow simultaneous amplification of the WDM signal.
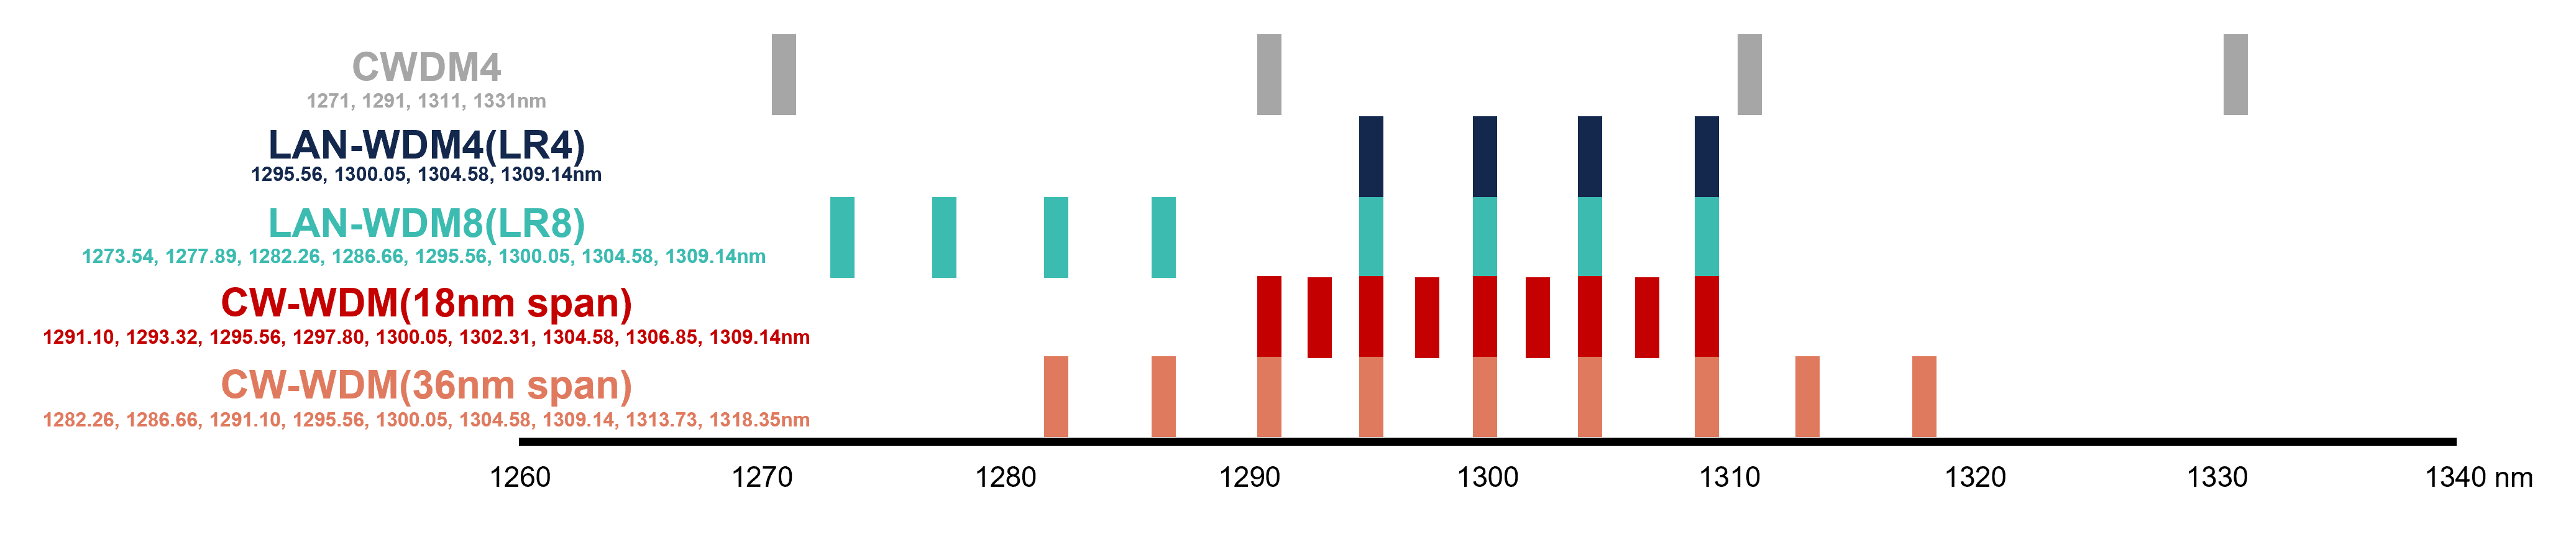
Figure 1: Center wavelength of grids for CWDM4, LAN-WDM4, LAN-WDM8 and CW-WDM.
In this blog, we present two types of flagship fiber amplifier models – Praseodymium-doped fiber amplifier (PDFA) and Bismuth-doped fiber amplifier (BDFA). We show, with experimental results, the pros and cons of these two products for WDM amplification. This result will be one guideline on how to choose an appropriate amplifier model depending on the WDM grid of interest.
Our new model of PDFA (AMP-FL8612-OB-27) can deliver more than 27-dBm output power from a 0-dBm input signal light, which is the highest output power among commercially available fiber amplifiers in the O-band. We will be launching it in the second quarter of 2026. The output power of our new BDFA (AMP-FL8621-OB-19) is 19 dBm with the input power of 0 dBm. Although the output power is lower than that of the PDFA, it can amplify a wider wavelength bandwidth.
We have manufactured demo units for these two models for both internal and customer evaluation. Preliminary data sheets can be downloaded from the link below.
Our evaluation of these two demo units was conducted by the amplification of WDM signals. Two types of input signal patterns, LR8 (0 dBm/ch) and CW-WDM (36-nm span, 8+1 ch, 0 dBm/ch), are used for amplification test of the PDFA and BDFA. The schematic diagram of the experimental setup is depicted in Fig.2, and the output spectra of these fiber amplifiers with the LR8 and CW-WDM input signals are shown in Fig.3 and Fig.4, respectively.
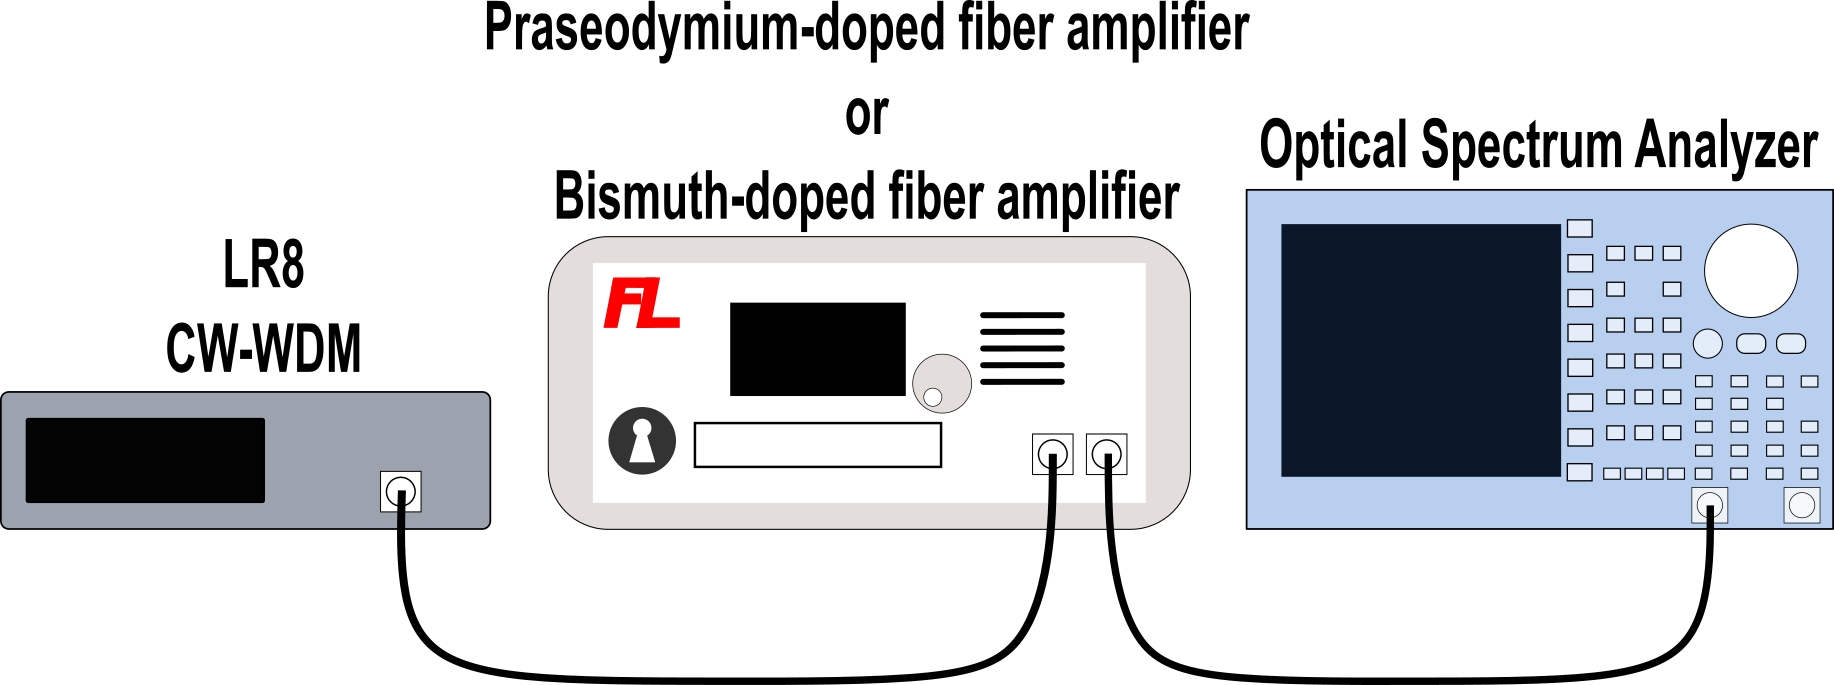
Figure 2: Schematic diagram of the experimental setup for amplification of LR8 and CW-WDM signal by using PDFA and BDFA.
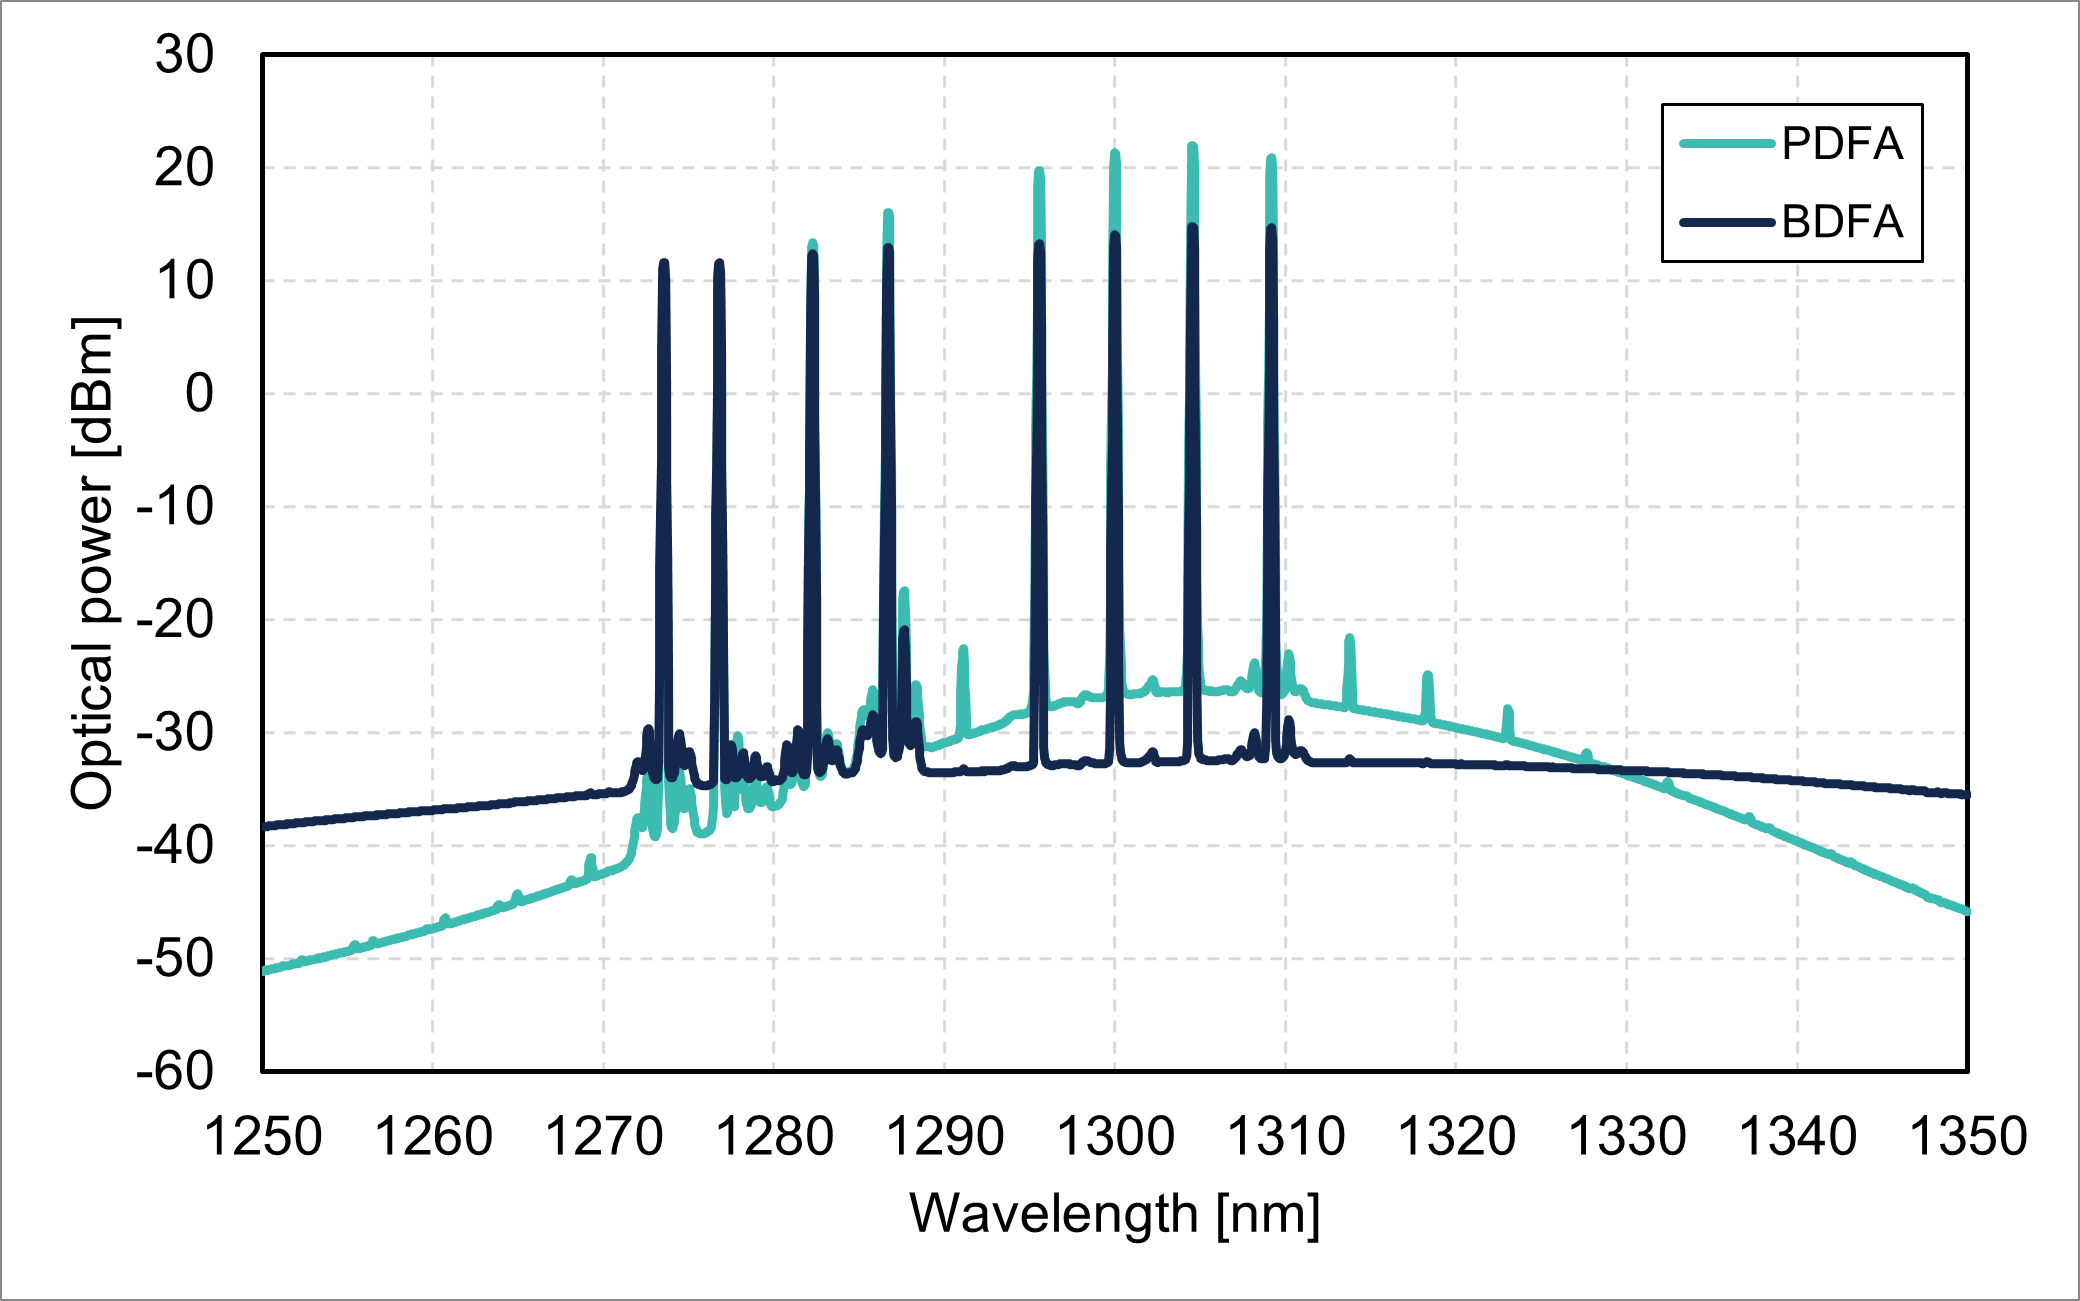
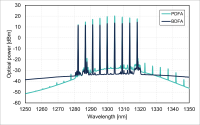
Figure 3: Output spectra from PDFA and BDFA with the 0-dBm input signal of LR8.
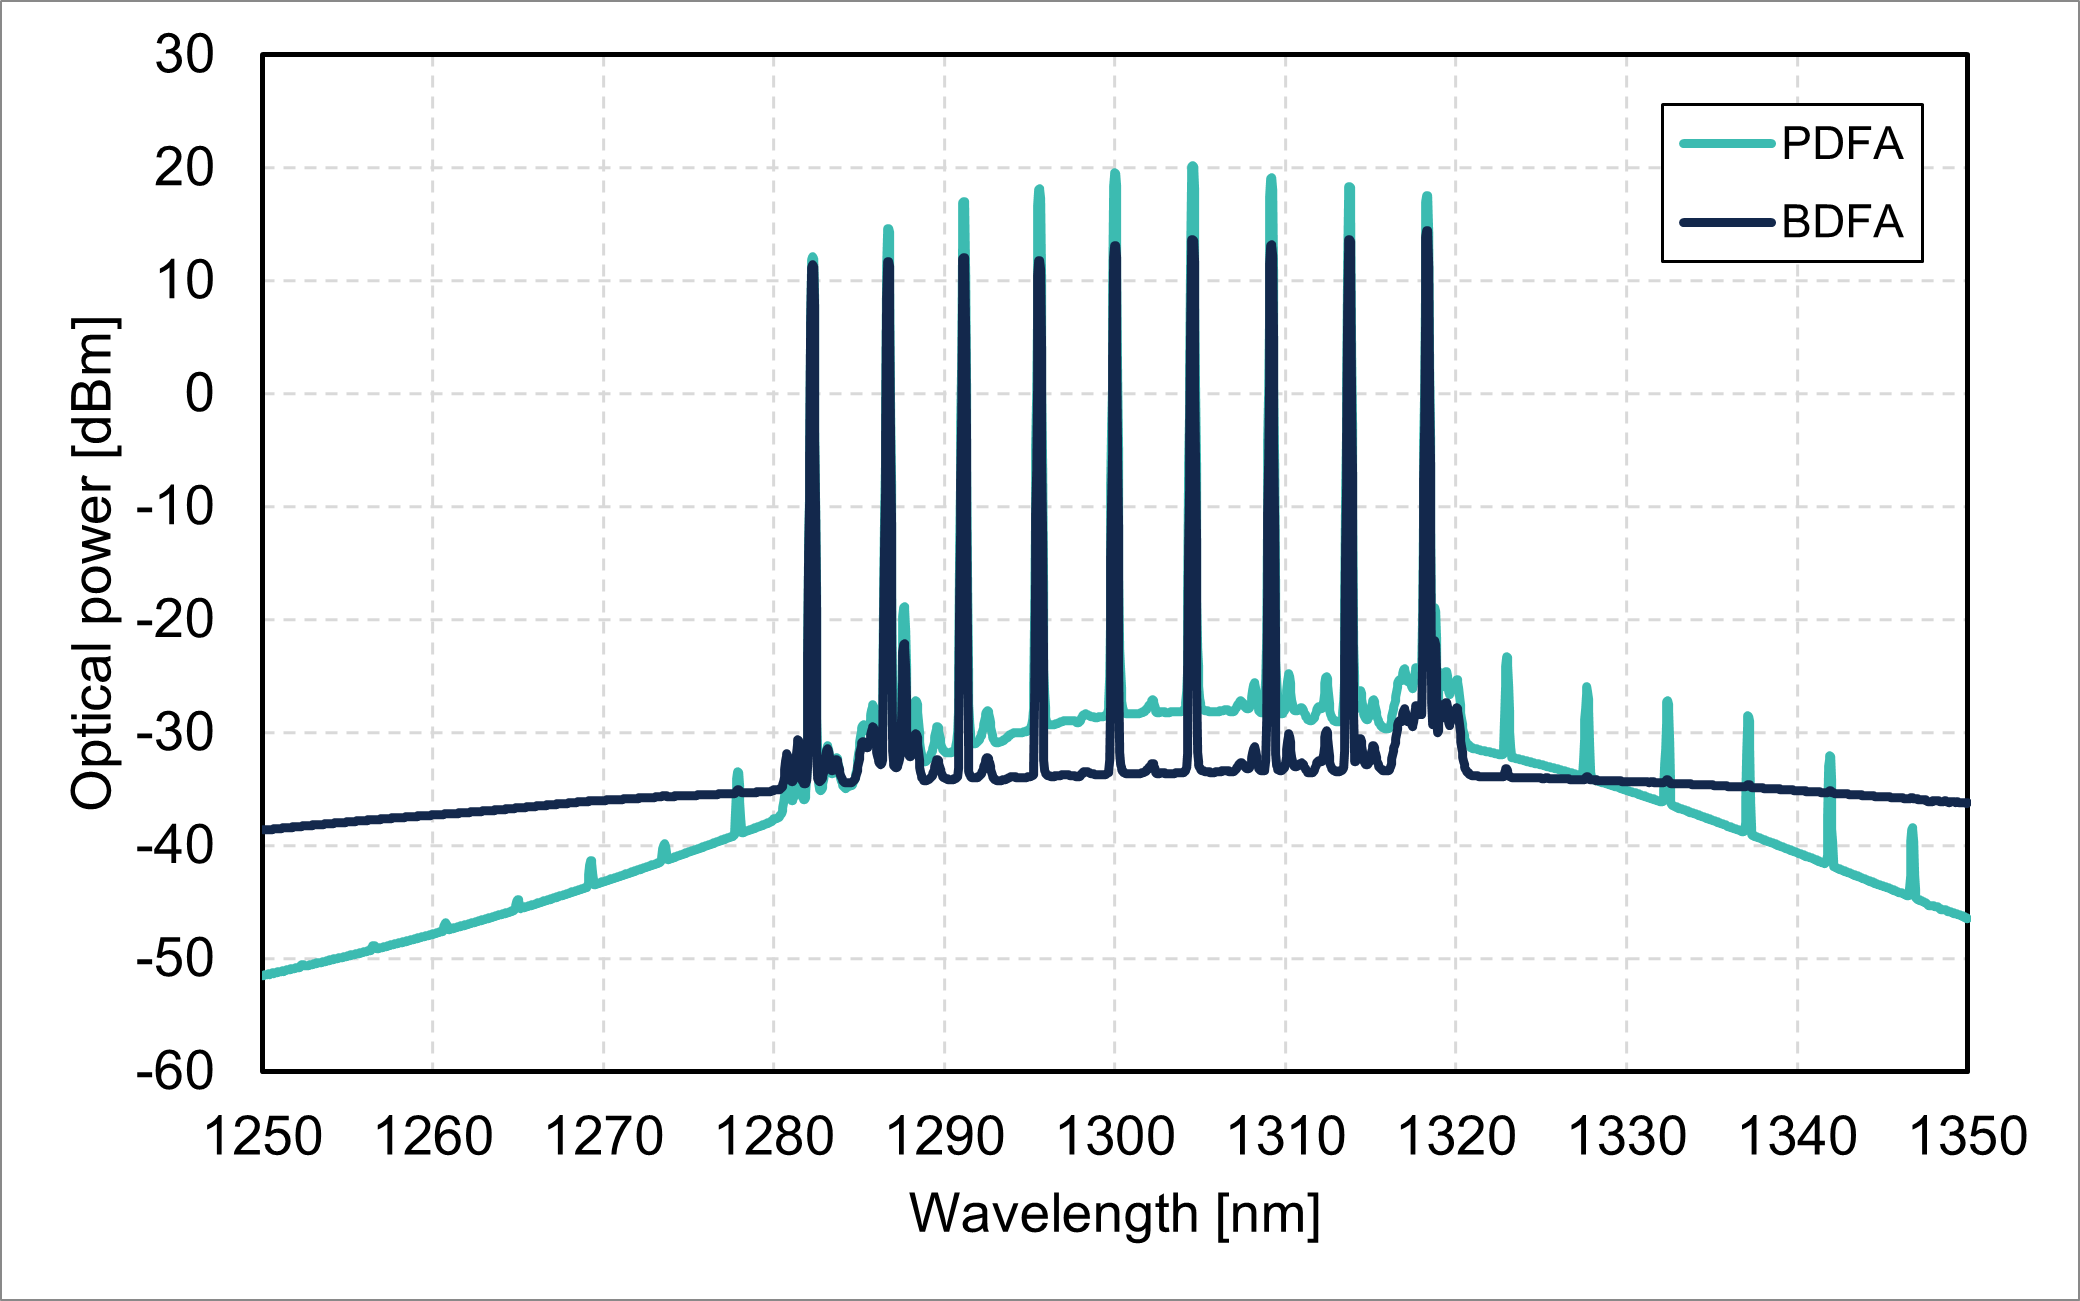
Figure 4: Output spectra from PDFA and BDFA with the 0-dBm input signal of CW-WDM (36-nm span).
It was observed that the BDFA has a higher gain than that of the PDFA for the short wavelength signals of LR8 shown in Fig.3, which indicates that the BDFA is appropriate to amplify wideband signals such as LR8 and CWDM4 transmission.
On the other hand, the output power of the PDFA is remarkable especially in the wavelength between 1285 and 1325nm, as shown in Fig.4. This result shows that the use of PDFA is preferred for LR4 and CW-WDM amplification.
Based on these results, suitable applications for PDFA and BDFA are classified as shown in the table below.
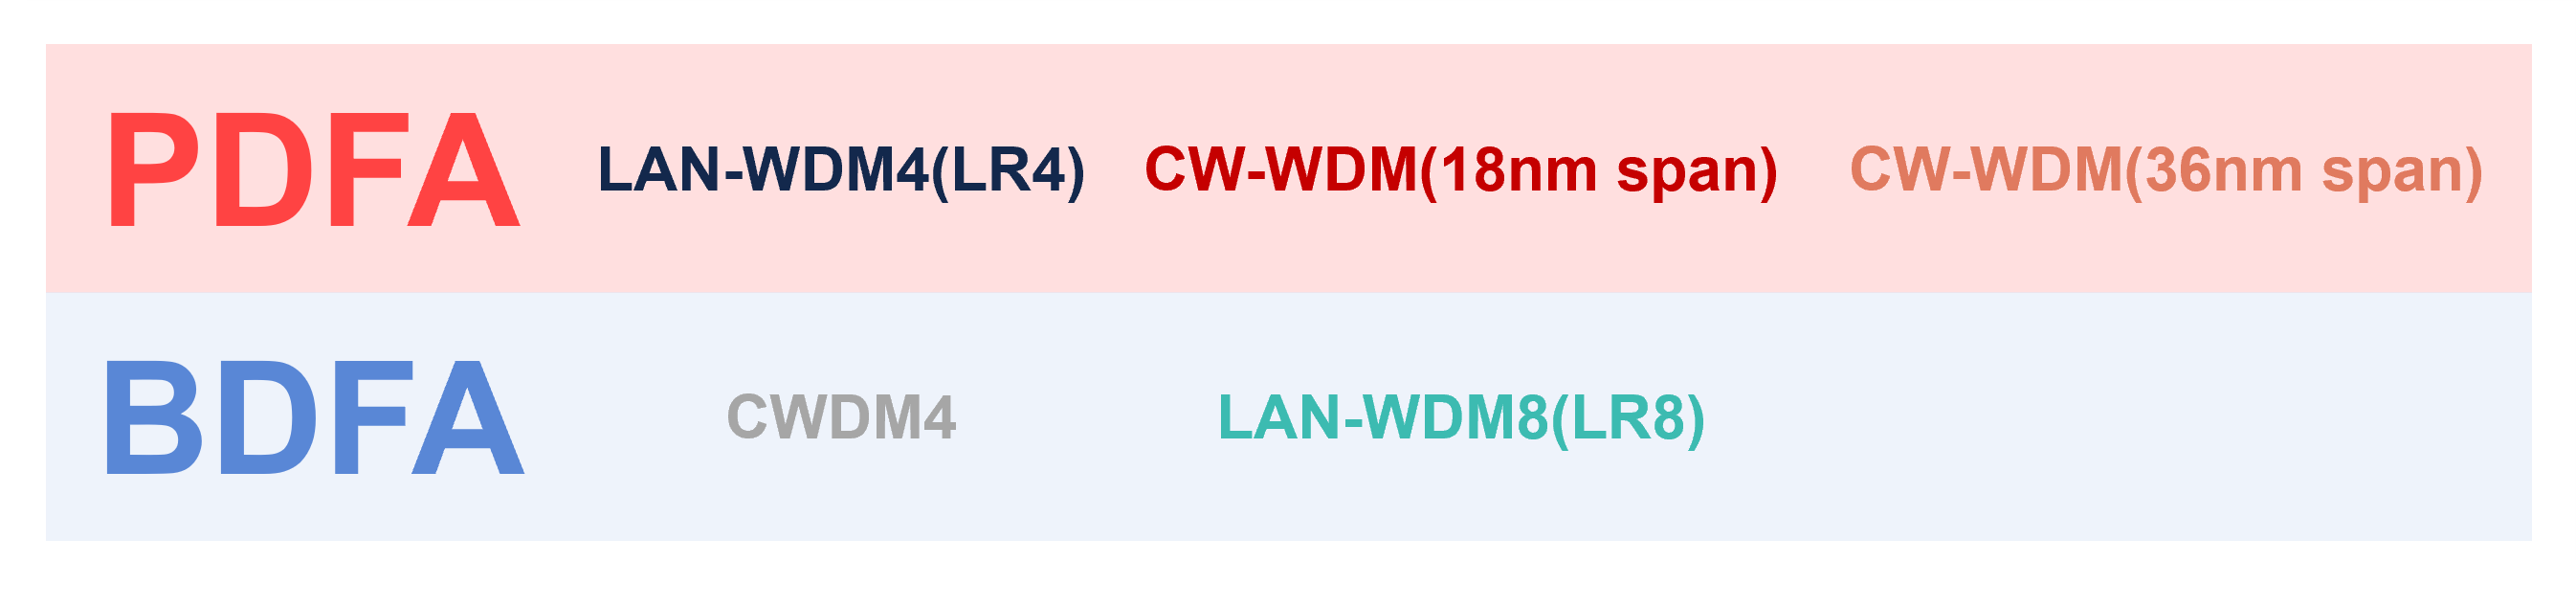
Figure 5: Appropriate applications of PDFA and BDFA for amplification of WDM signals.
While this guideline focuses only on WDM signal amplification, these products are available for a variety of non-WDM applications such as single-channel transceiver testing, multiphoton microscopy (MPM), optical coherence tomography (OCT) and laser processing.
Please feel free to contact us via the request sheet if you are interested in using our demo units for your application.
link Started offering O-band BDFA
Fiberlabs Inc., a leading manufacturer of O-band fiber amplifiers offering the most reliable and highest output power Praseodymium-Doped Fiber Amplifier (PDFA) ( Blog > O-band PDFA achieves 500-mW output), has started offering a wideband BDFA at O-band.
Recently, O-band amplifiers have attracted a lot of interest due to the rapid growth of network traffic demand. Among O-band amplifiers, a Bismuth-Doped Fiber Amplifier (BDFA) is one of the most attractive configurations because of its wide working wavelength range.
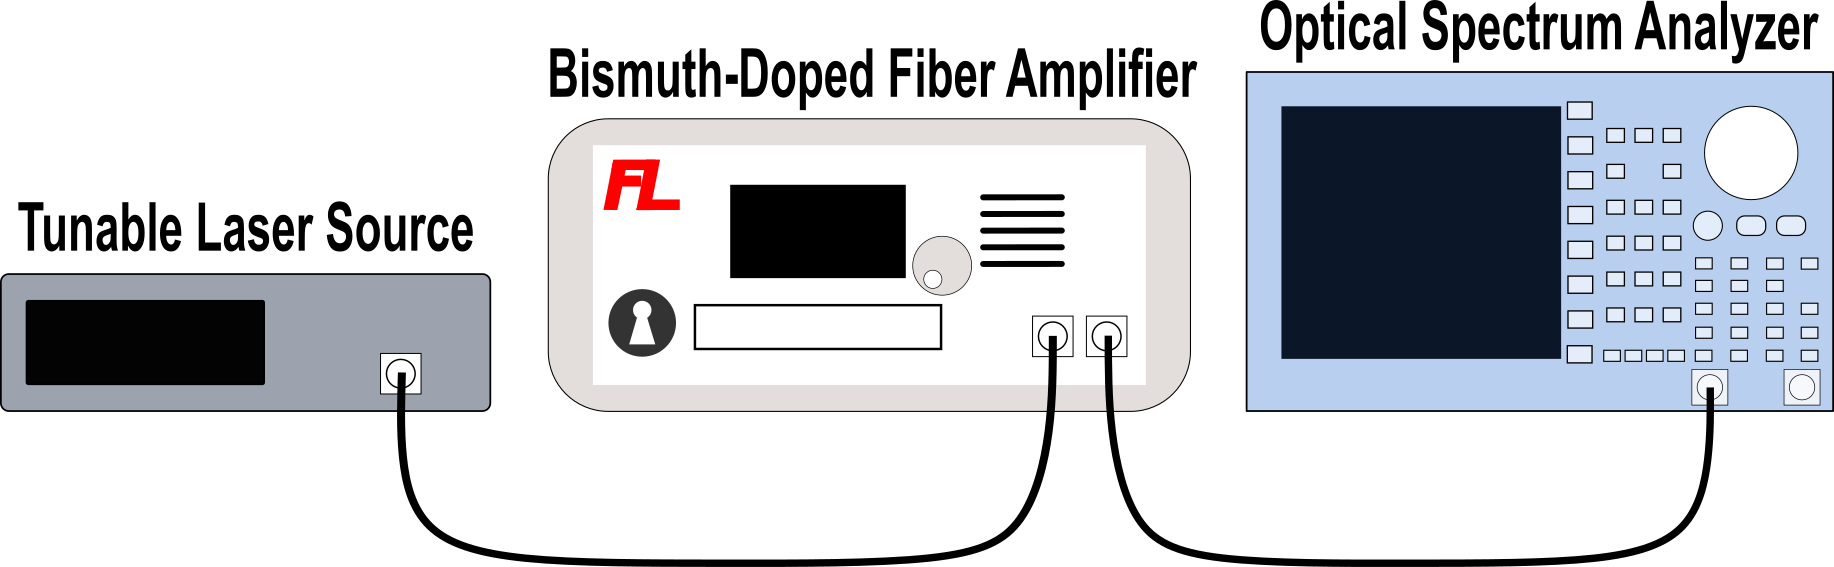
A single-frequency light from a tunable laser source is amplified by the BDFA, and the output from the BDFA is measured by an optical spectrum analyzer (figure 1). As can be seen from the measurement results shown in figure 2 and 3, our new BDFA has been found to achieve a high gain of 21 dB from a 0-dBm input at 1310 nm. In particular, the gain bandwidth is extremely wide, which is advantageous for a number of applications such as CWDM4 signal amplification.
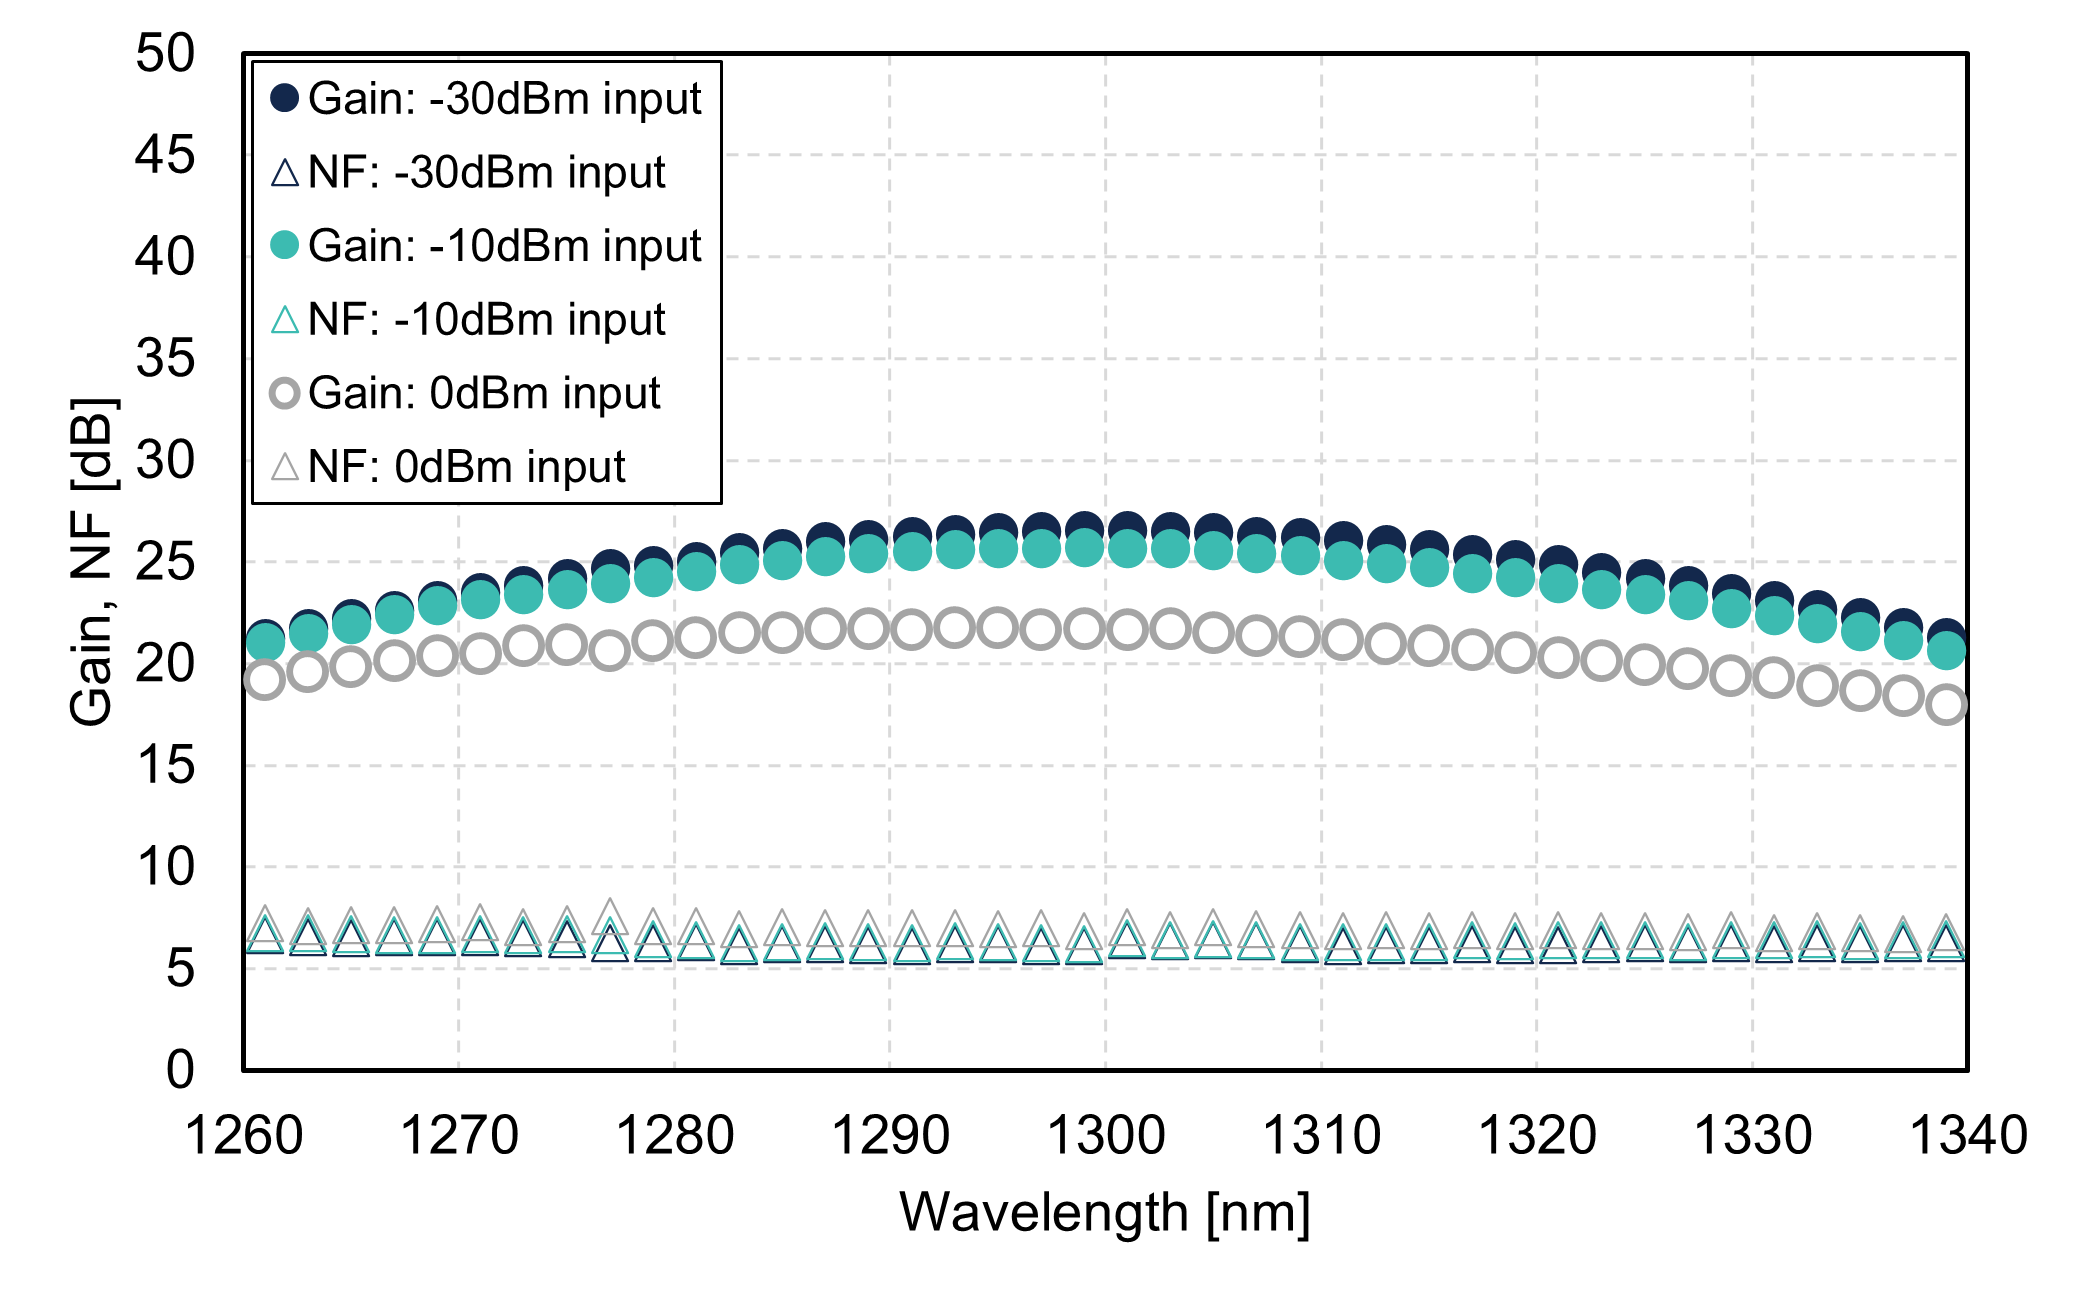
Figure 2: Gain/noise figure vs wavelength.
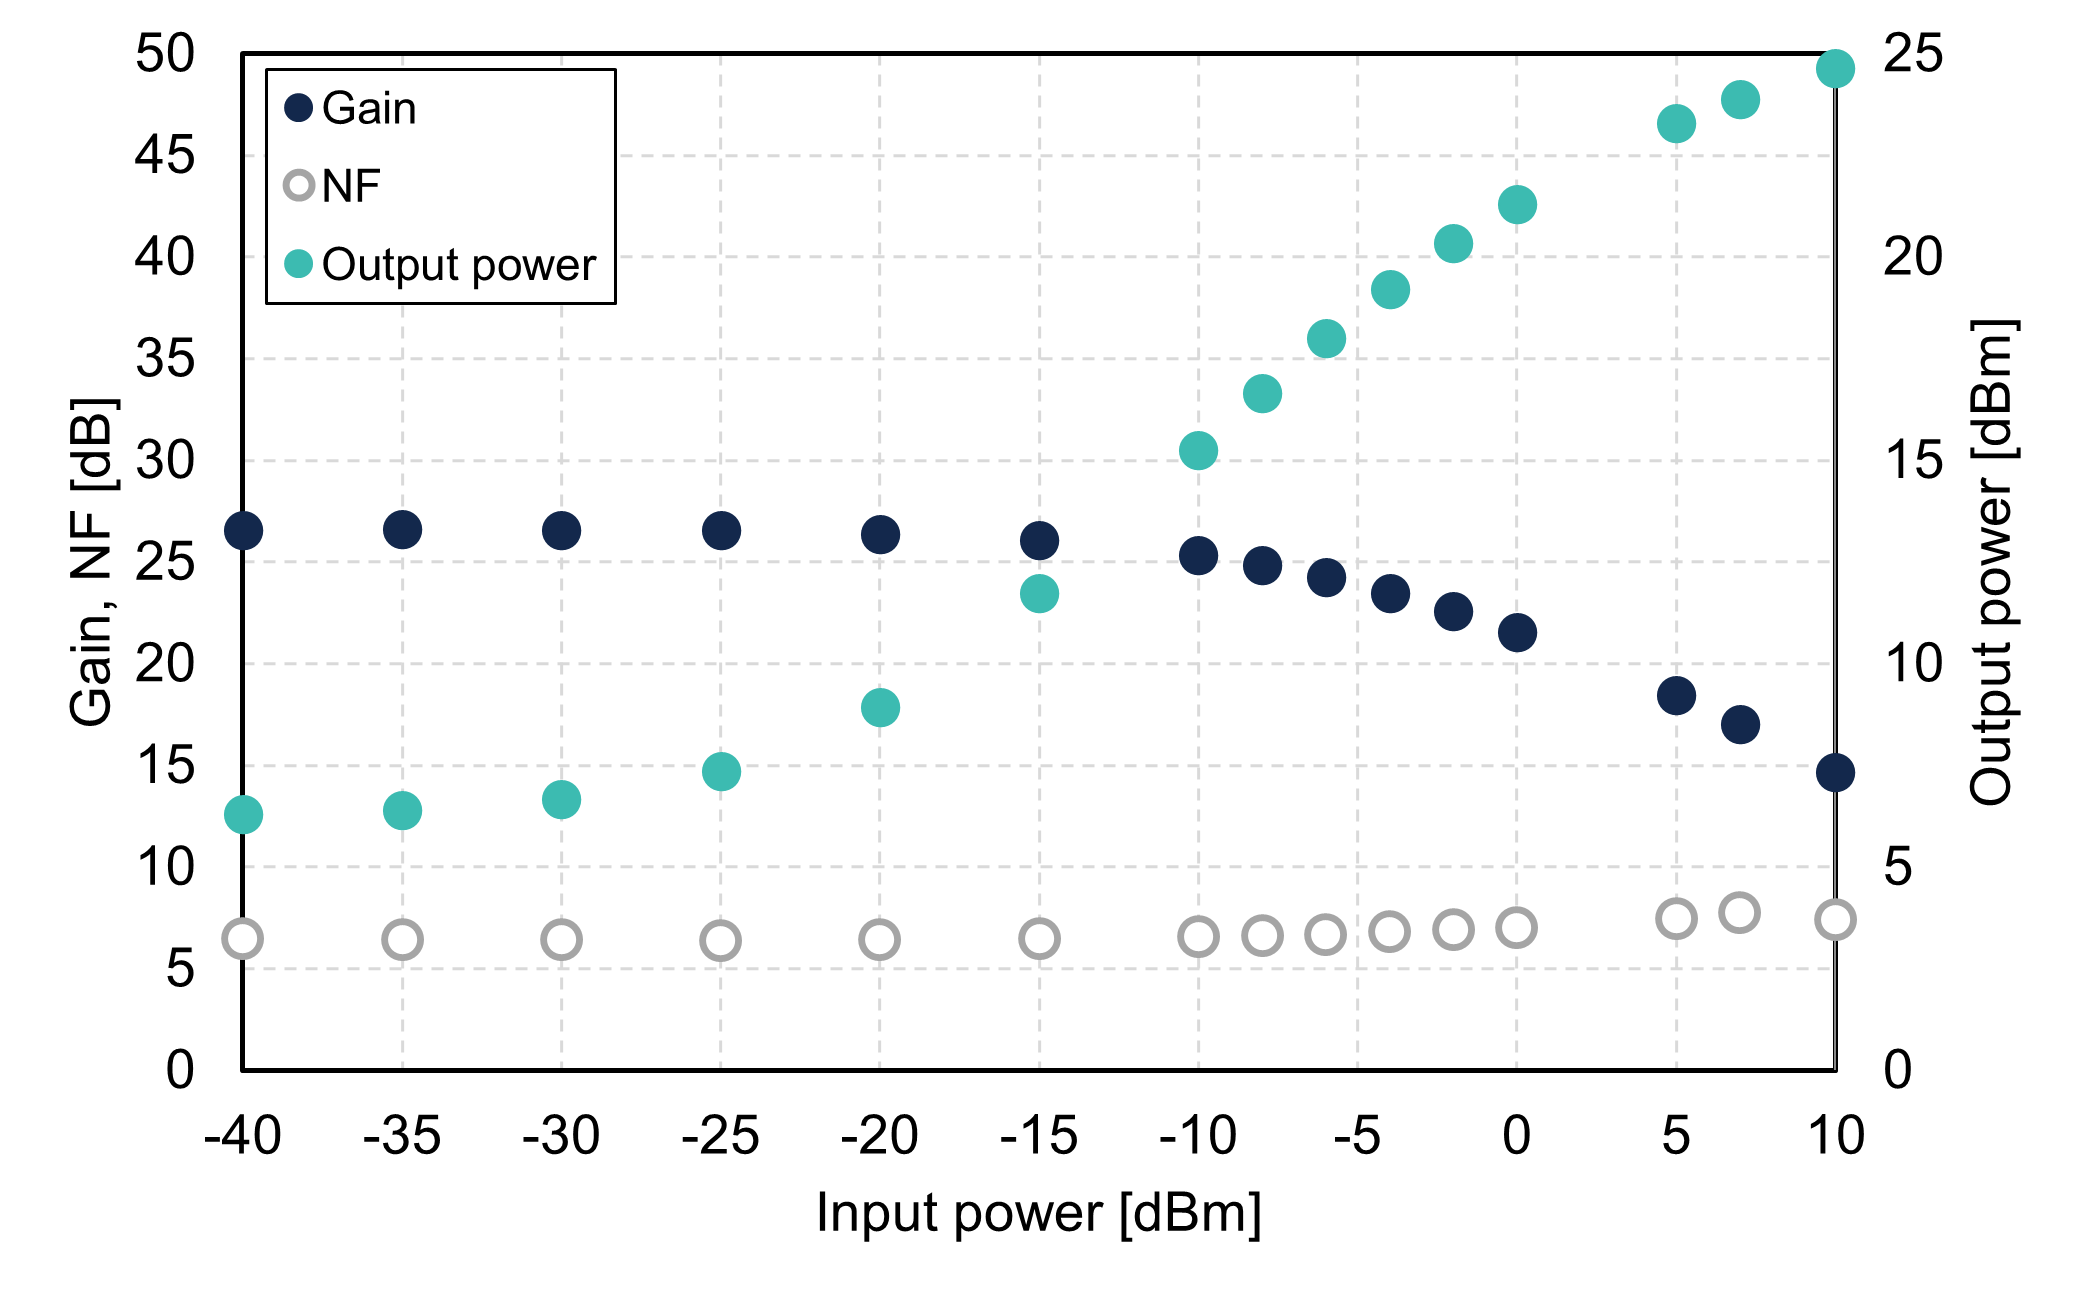
Figure 2: Gain/NF/output power vs. input power @1310 nm.
We conducted an additional experiment to see its CWDM4 amplification performance. The amplification was evaluated using four signals (0dBm/ch) that were simultaneously launched to the amplifier as the input signal. The launched and amplified spectra are shown in Fig.4, demonstrating that the CWDM4 signals were simultaneously amplified with more than 10dB gain and less than 4dB gain deviation. These advantages of our BDFA would not be limited for the CWDM4 amplification, and it has great potential to fill the wavelength gap that cannot be reached by rare-earth-doped fibers.
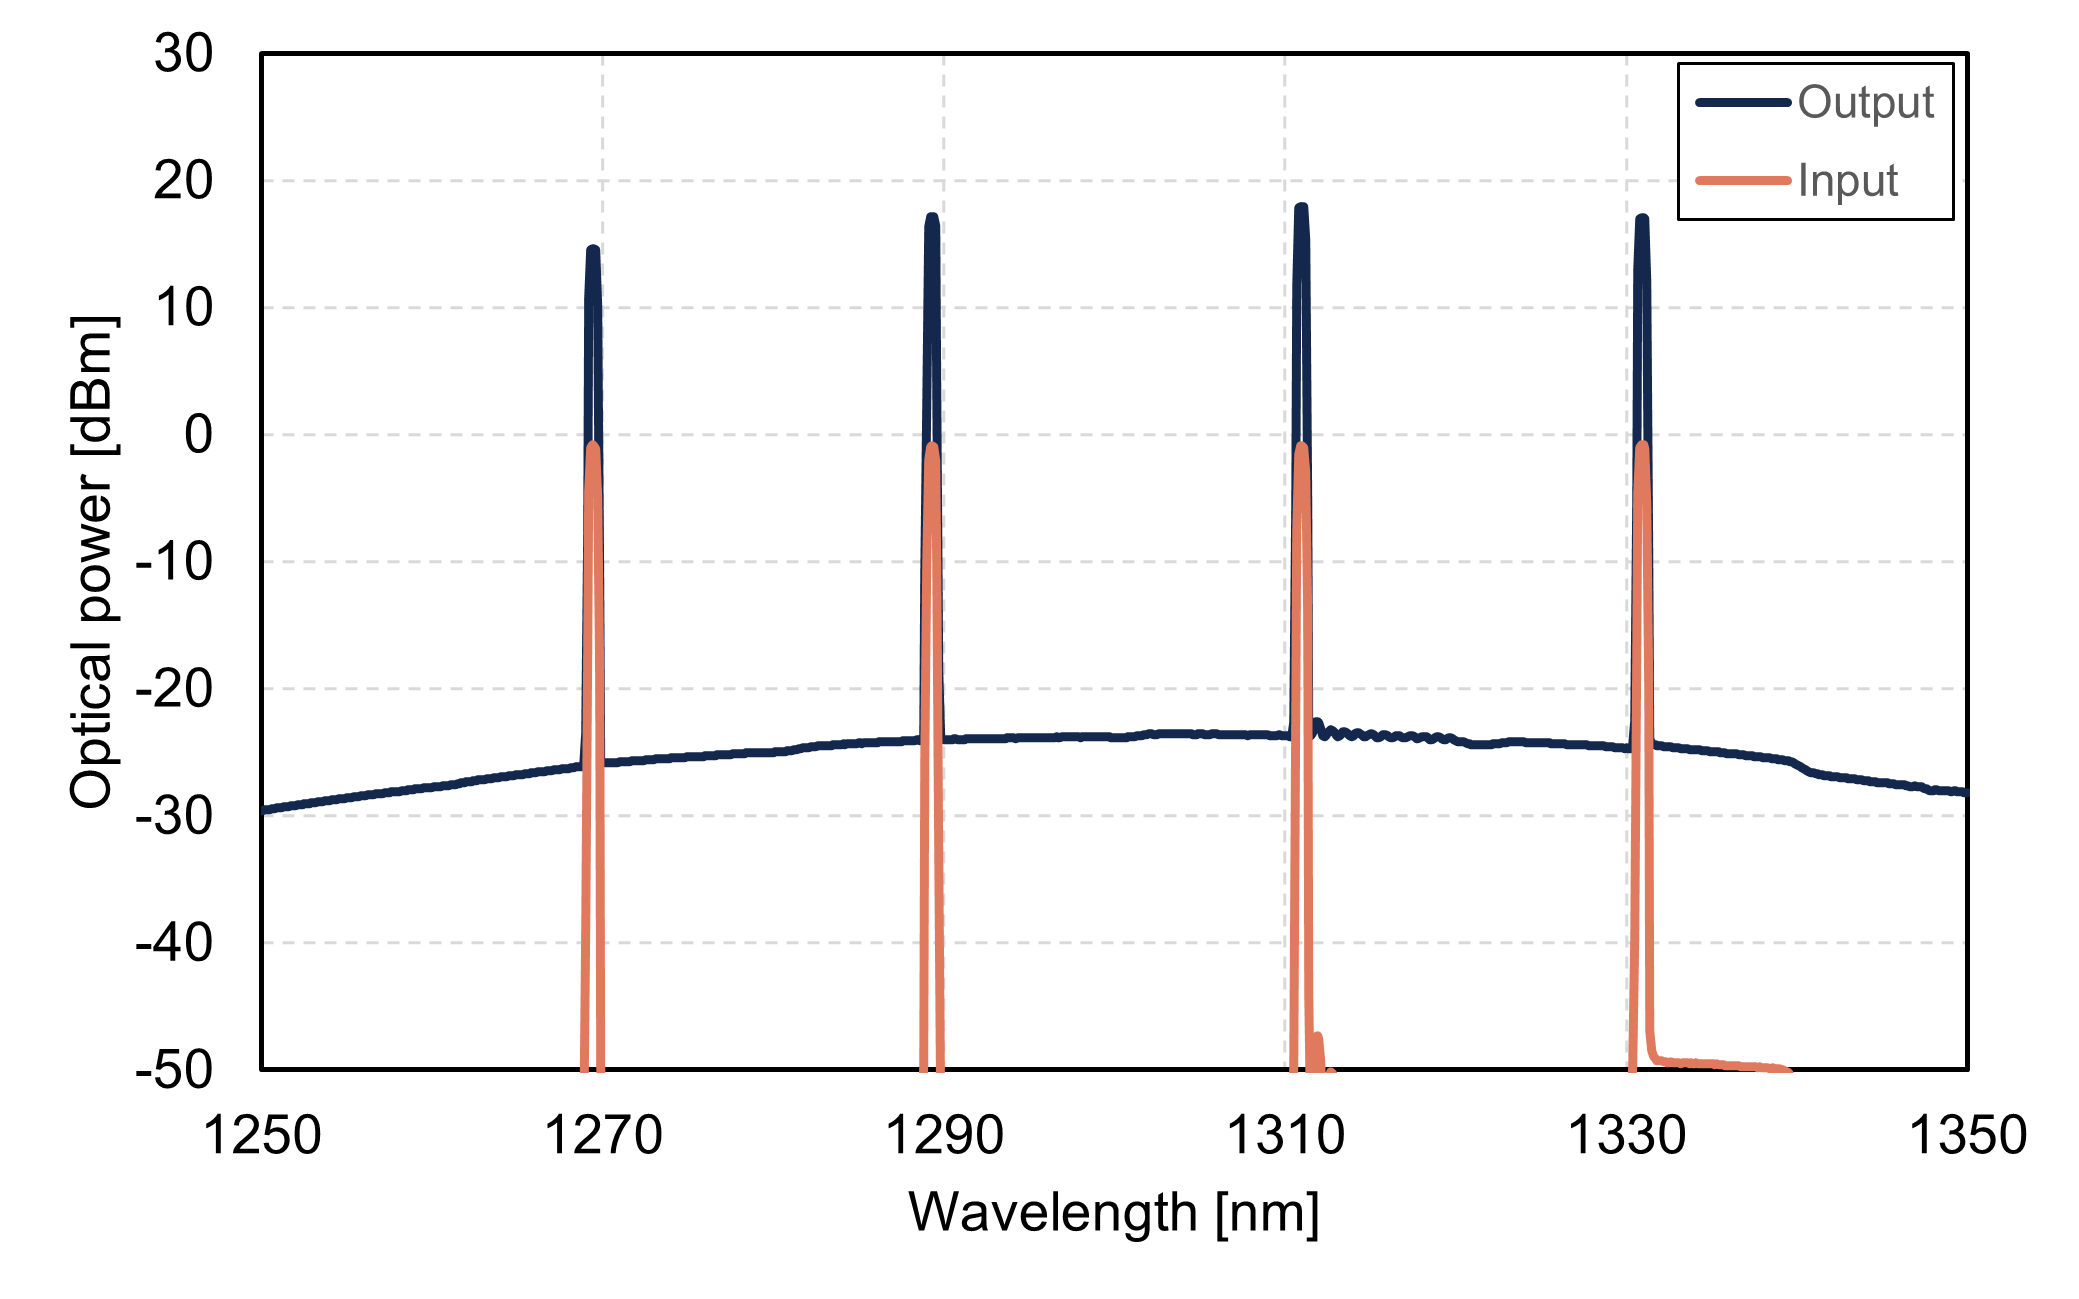
Figure 3: Amplification characteristics for CWDM4 signal.
Thank you for your interest in our BDFA. Because BDFA is a relatively new and rare-earth-free technology, its full potential across various applications is still being discovered. We believe that exploring its full capabilities is essential to unlock its many advantages. We encourage you to test our demo unit to see firsthand how BDFA can be integrated into your systems and deliver superior performance. We are grateful for your contact and inquiry about our BDFA.
link Polarization Maintaining O-band PDFA demo unit available
We announce a polarization-maintaining O-band Praseodymium-doped fiber amplifier is available as demo unit. It offers great optical performance such as, broad gain bandwidth, high gain, low noise figure and high polarization extinction ratio. Both Automatic Current Control (ACC) and Automatic Light Control (ALC) modes are available to amplifier control. Please note that only one polarization axis (fast axis) is allow to propagate the signal line. And the high-power narrow-linewidth of signal might hinder the stable operation. In the case of use a Distributed Feedback (DFB) laser (sub-MHz linewidth) as the signal light, less than 2 dBm might be better to avoid output power fluctuations.
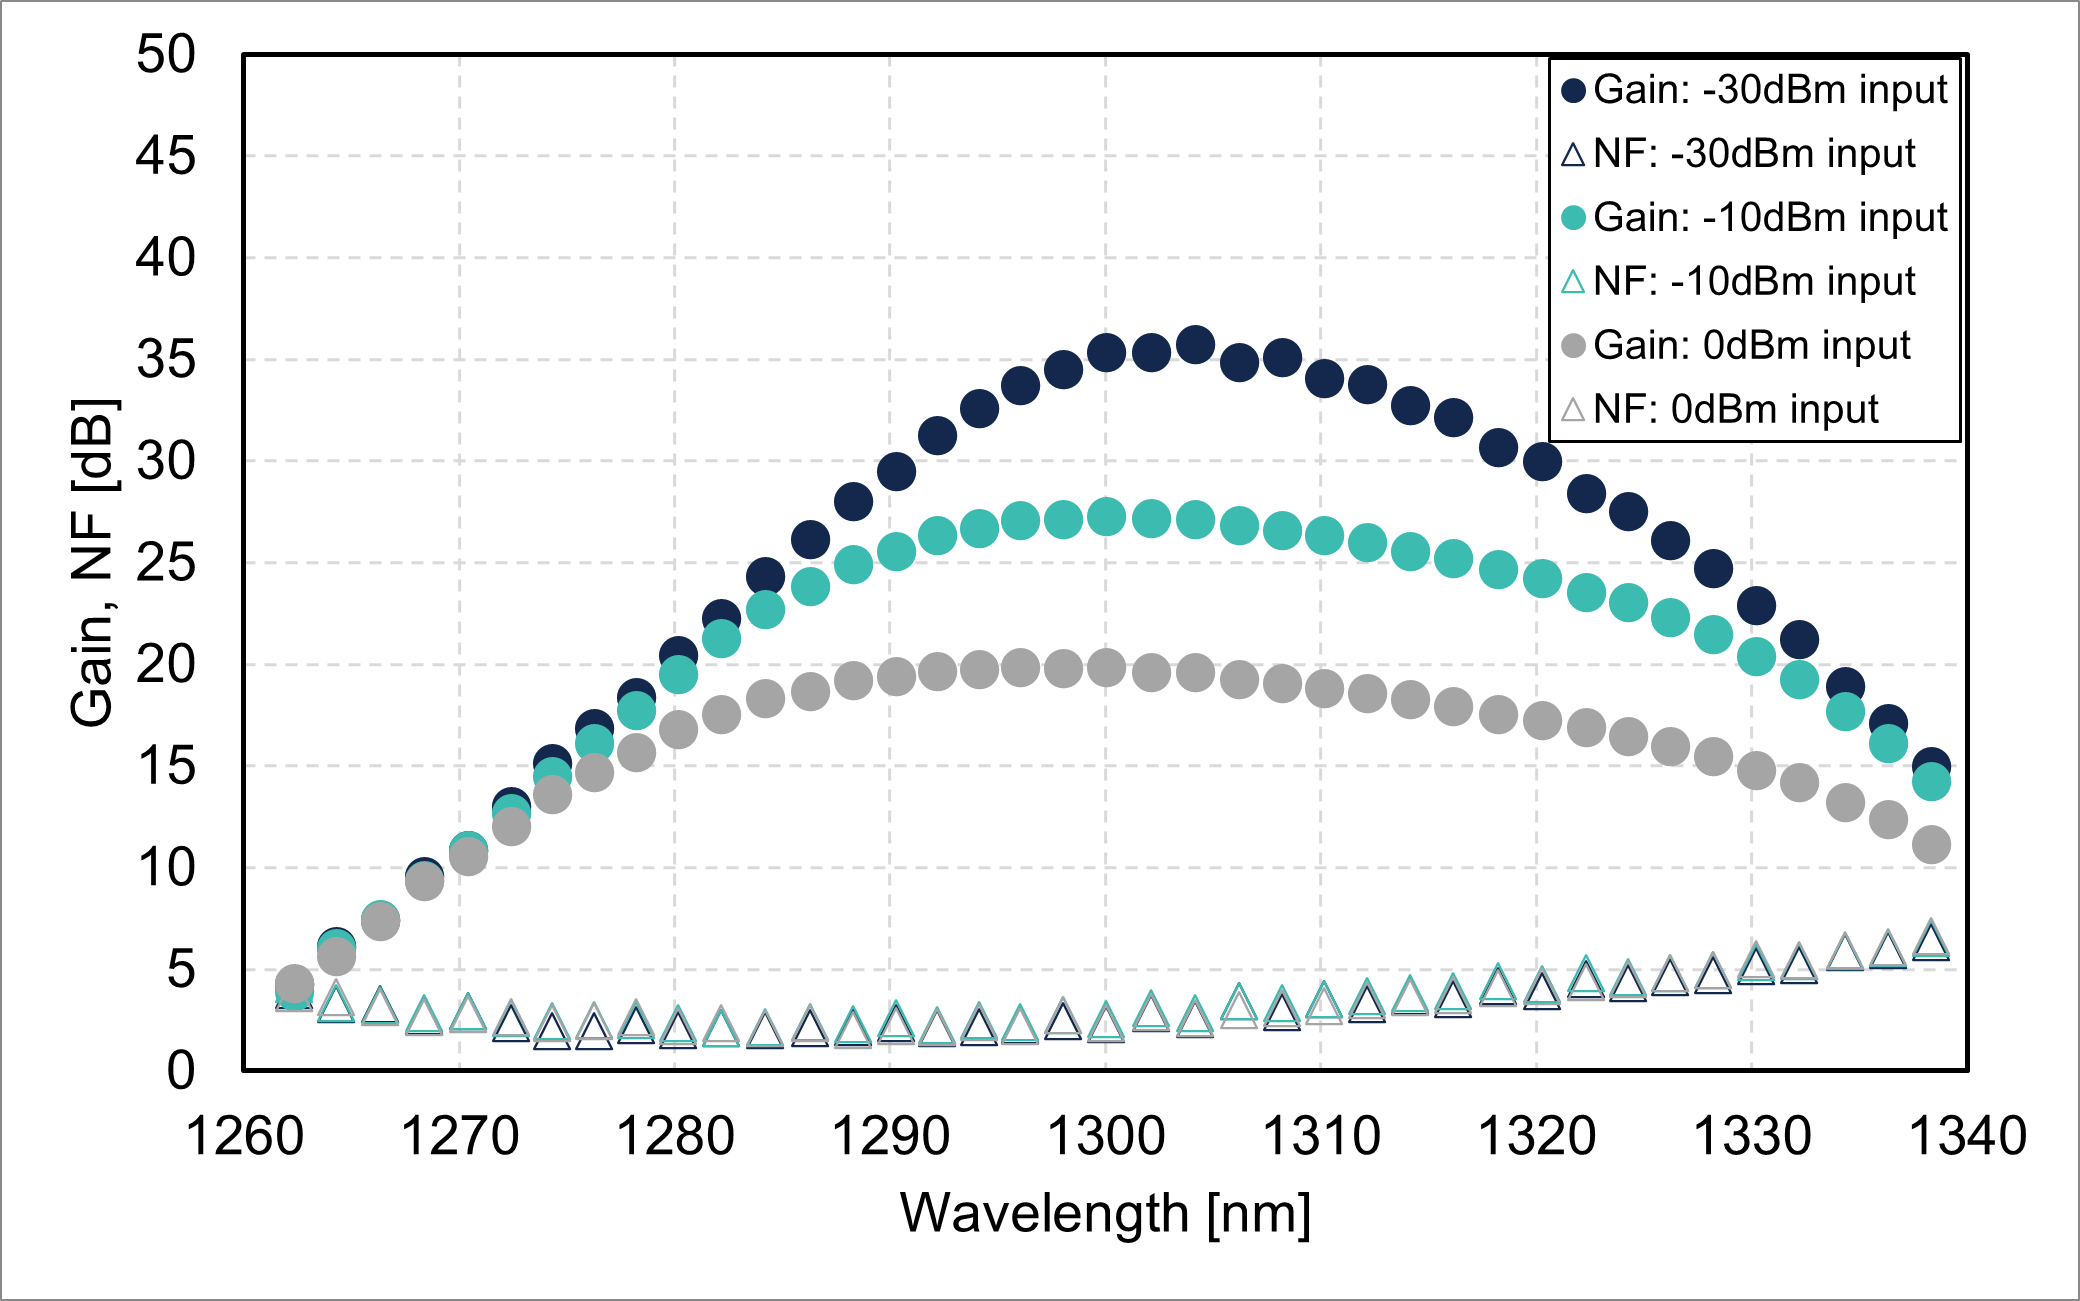
Figure 1: Gain/noise figure vs. wavelength (FL8613-OB-18)
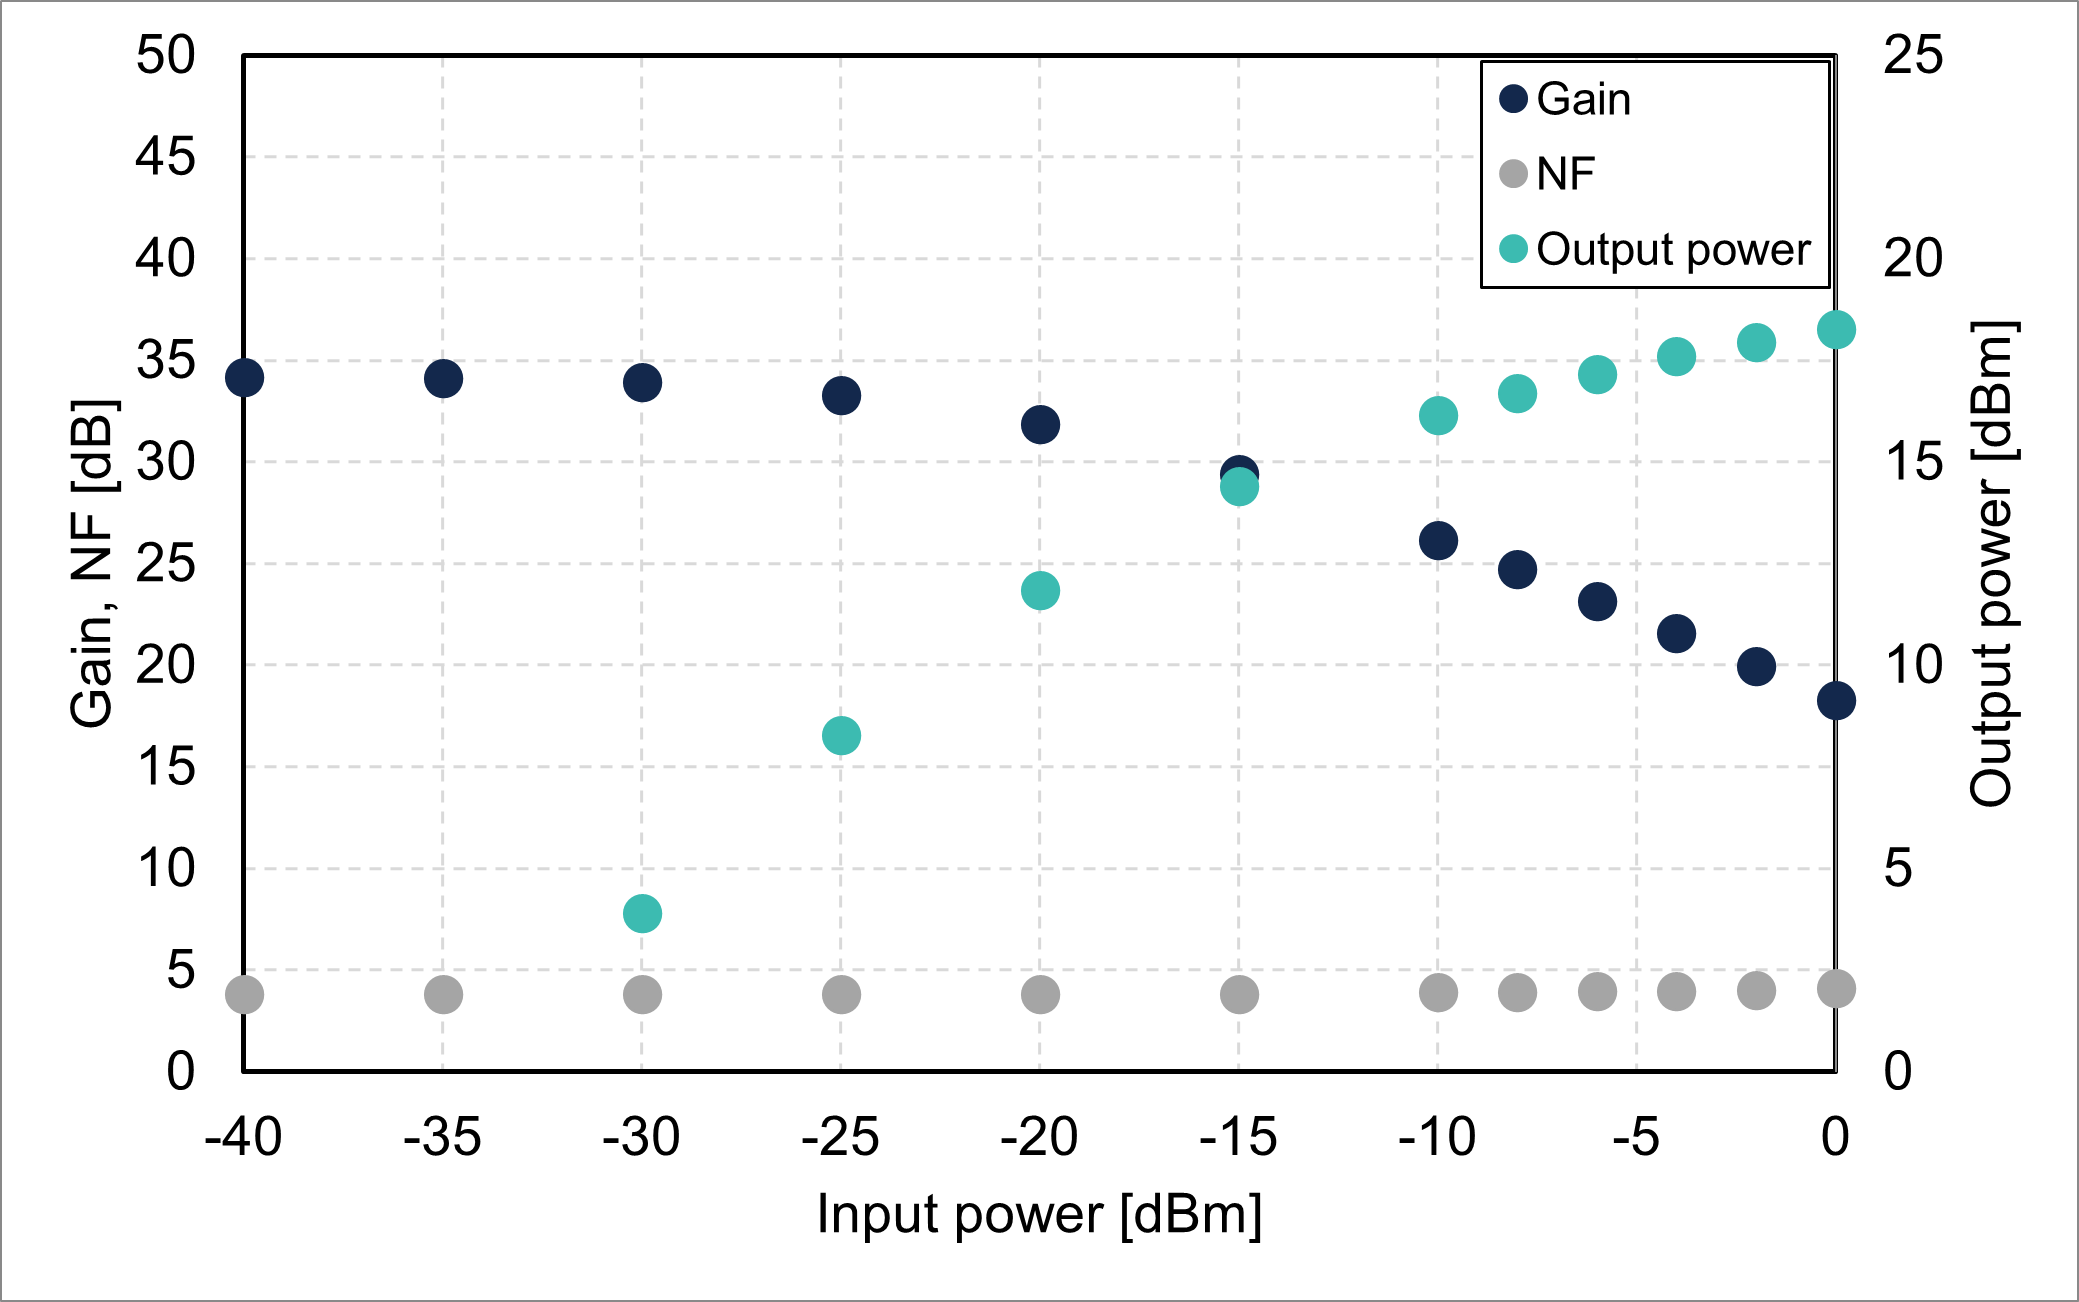
Figure 2: Gain/NF/output power vs. input power @1310 nm (FL8613-OB-18)

link High-power single-mode fiber amplifier at 810 nm
High-power, diffraction-limited light source around 800 nm has long been relied on Titanium-Sapphire laser (Ti:Sapphire laser), which provides watt-class output power with a very broad tuning range. The use of the laser is, however, limited in lab environments only, as it needs to be installed on a large anti-vibration optical table placed in temperature controlled environment.
A high-power tapered semiconductor optical amplifier, seeded by a low-power seed laser, offers small footprint and watt-class output power. The long-term stability of beam quality, however, remains an issue.
In this post, we demonstrate a Thulium (Tm) doped ZBLAN fiber amplifier system for creating a high-power single-mode light source at 810 nm. Stable, diffraction-limited beam quality is ensured by single-mode fiber design. The light amplification originates from the 3H4→3H6 energy transition of Tm ions (see TDFA) doped in ZBLAN glass. Low phonon energy of ZBLAN glass, compared to that of silica glass, enables efficient light amplification around 810 nm.
The fiber amplifiers presented in this post are available for demo upon request. Though it is a proof-of-concept model and has not been released as our official product, most functions have been implemented for evaluation. Please contact us and show your interest, if you would like to test them for your project.
We first demonstrate amplification of narrow-linewidth seed laser operating at 813 nm. This wavelength (813.4 nm) is known as the magic wavelength for Strontium. A high-power narrow-linewidth light source with diffraction-limited beam quality has been of great interest for the creation of a Strontium optical lattice clock.
The setup of our experiment is schematically shown in Fig. 1. An External-Cavity Laser Diode (ECLD), tuned to 813 nm and generating 20-mW output power, comprised a seed laser. The output power from the seed laser was amplified by a dual-stage fiber amplifier system. The light was amplified to 70 mW at the first stage, and is further amplified to 300 mW at the second stage.
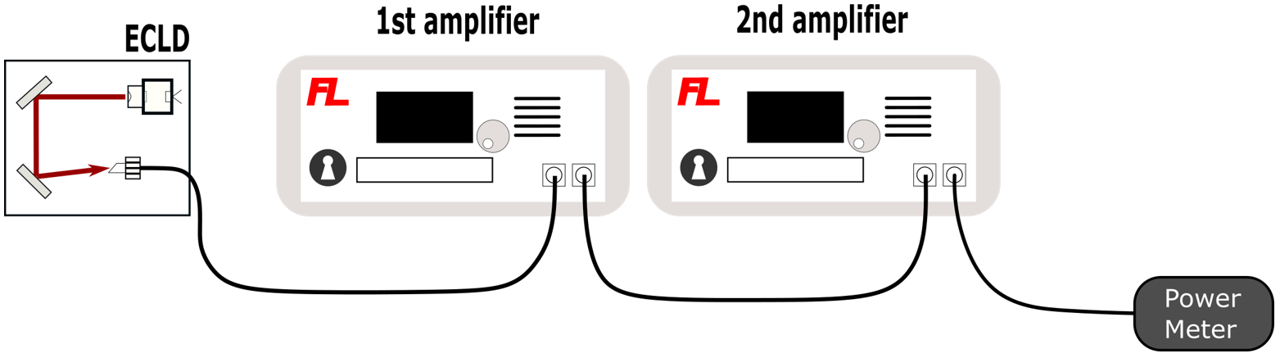
Figure 1: Schematic of dual-stage amplifier
Figure 2 shows normalized output spectra out of the ECLD and each of the two amplifier stages. The figure shows that the SNR (Signal-to-Noise Ratio) is about 50 dB after amplification, surpassing that of a tapered semiconductor optical amplifier.
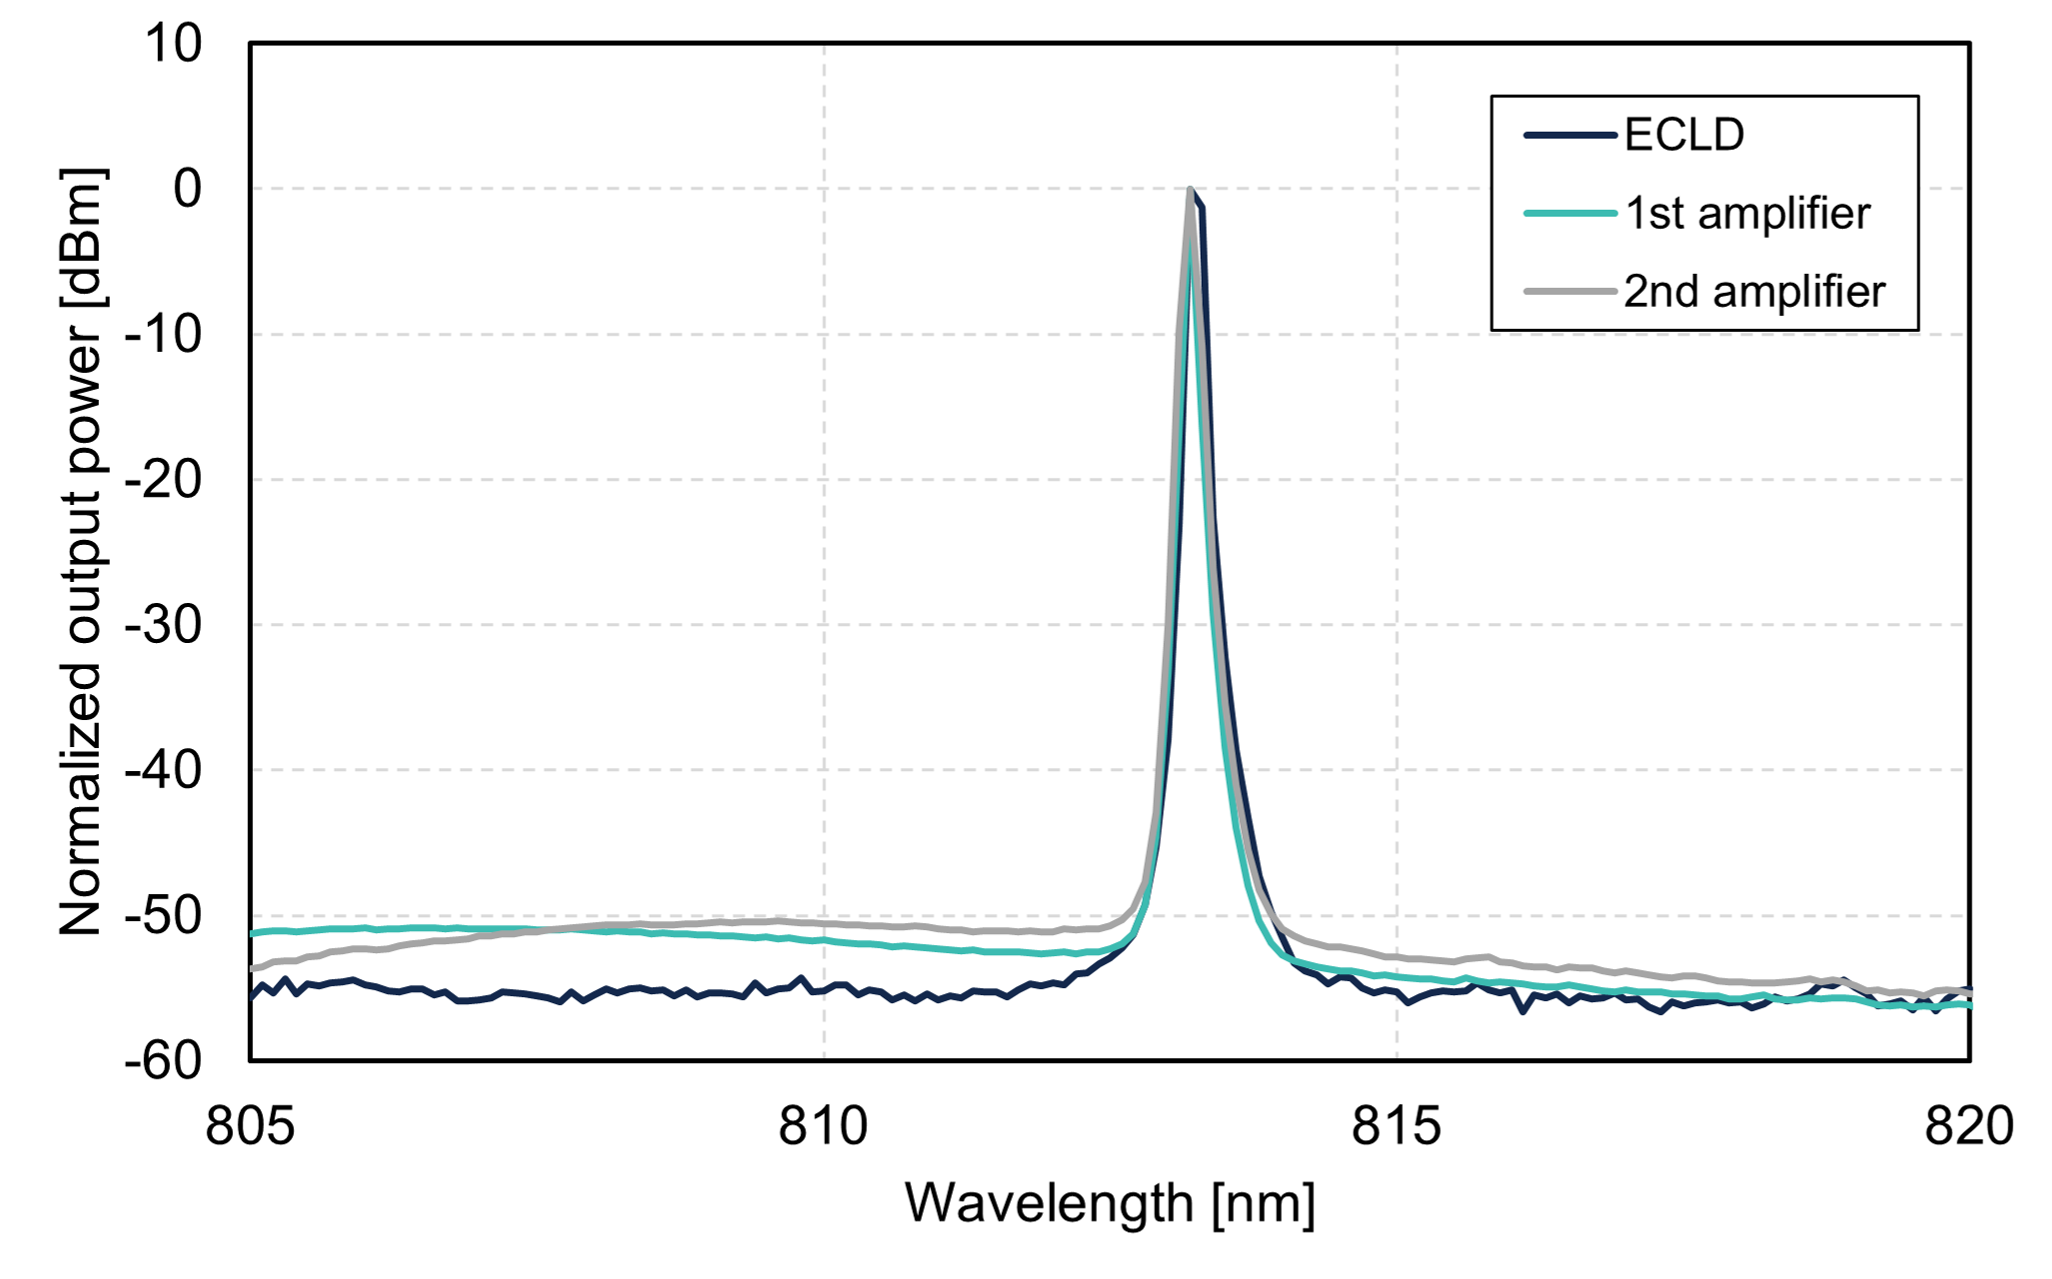
Figure 2: Normalized output spectra
The temporal variation of output power from the second amplifier is shown in Fig. 3. The dual-stage amplifier operated over 120 hours and the output power stability was less than 15%. The amplifier was operated in ACC mode, and thus the output power was affected by room temperature change (22 degC to 29 degC within one day). The output power stability would be improved by implementation of ALC mode.
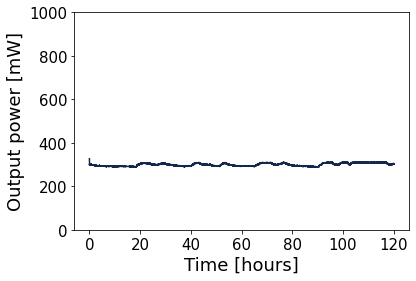
Figure 3: Temporal variation of output power from second amplifier
We next demonstrate amplification of a small-power ASE light source exceeding 200 mW. A fiber ASE source is a versatile light source, offering broad bandwidth and inherently low Degree-of-Polarization (DOP). Such a high-power broadband light source will be useful when your application requires low coherence and polarization insensitivity.
A picture of the amplifier system is shown in Fig. 4. This system is indeed the same as the one used for the previous narrow-linewidth amplification, except that there is no seed laser. When the first fiber amplifier is operated without input signal, it generates broadband ASE centered at 805 nm (see our previous post). The second amplifier amplifies the ASE light to more than 200 mW.
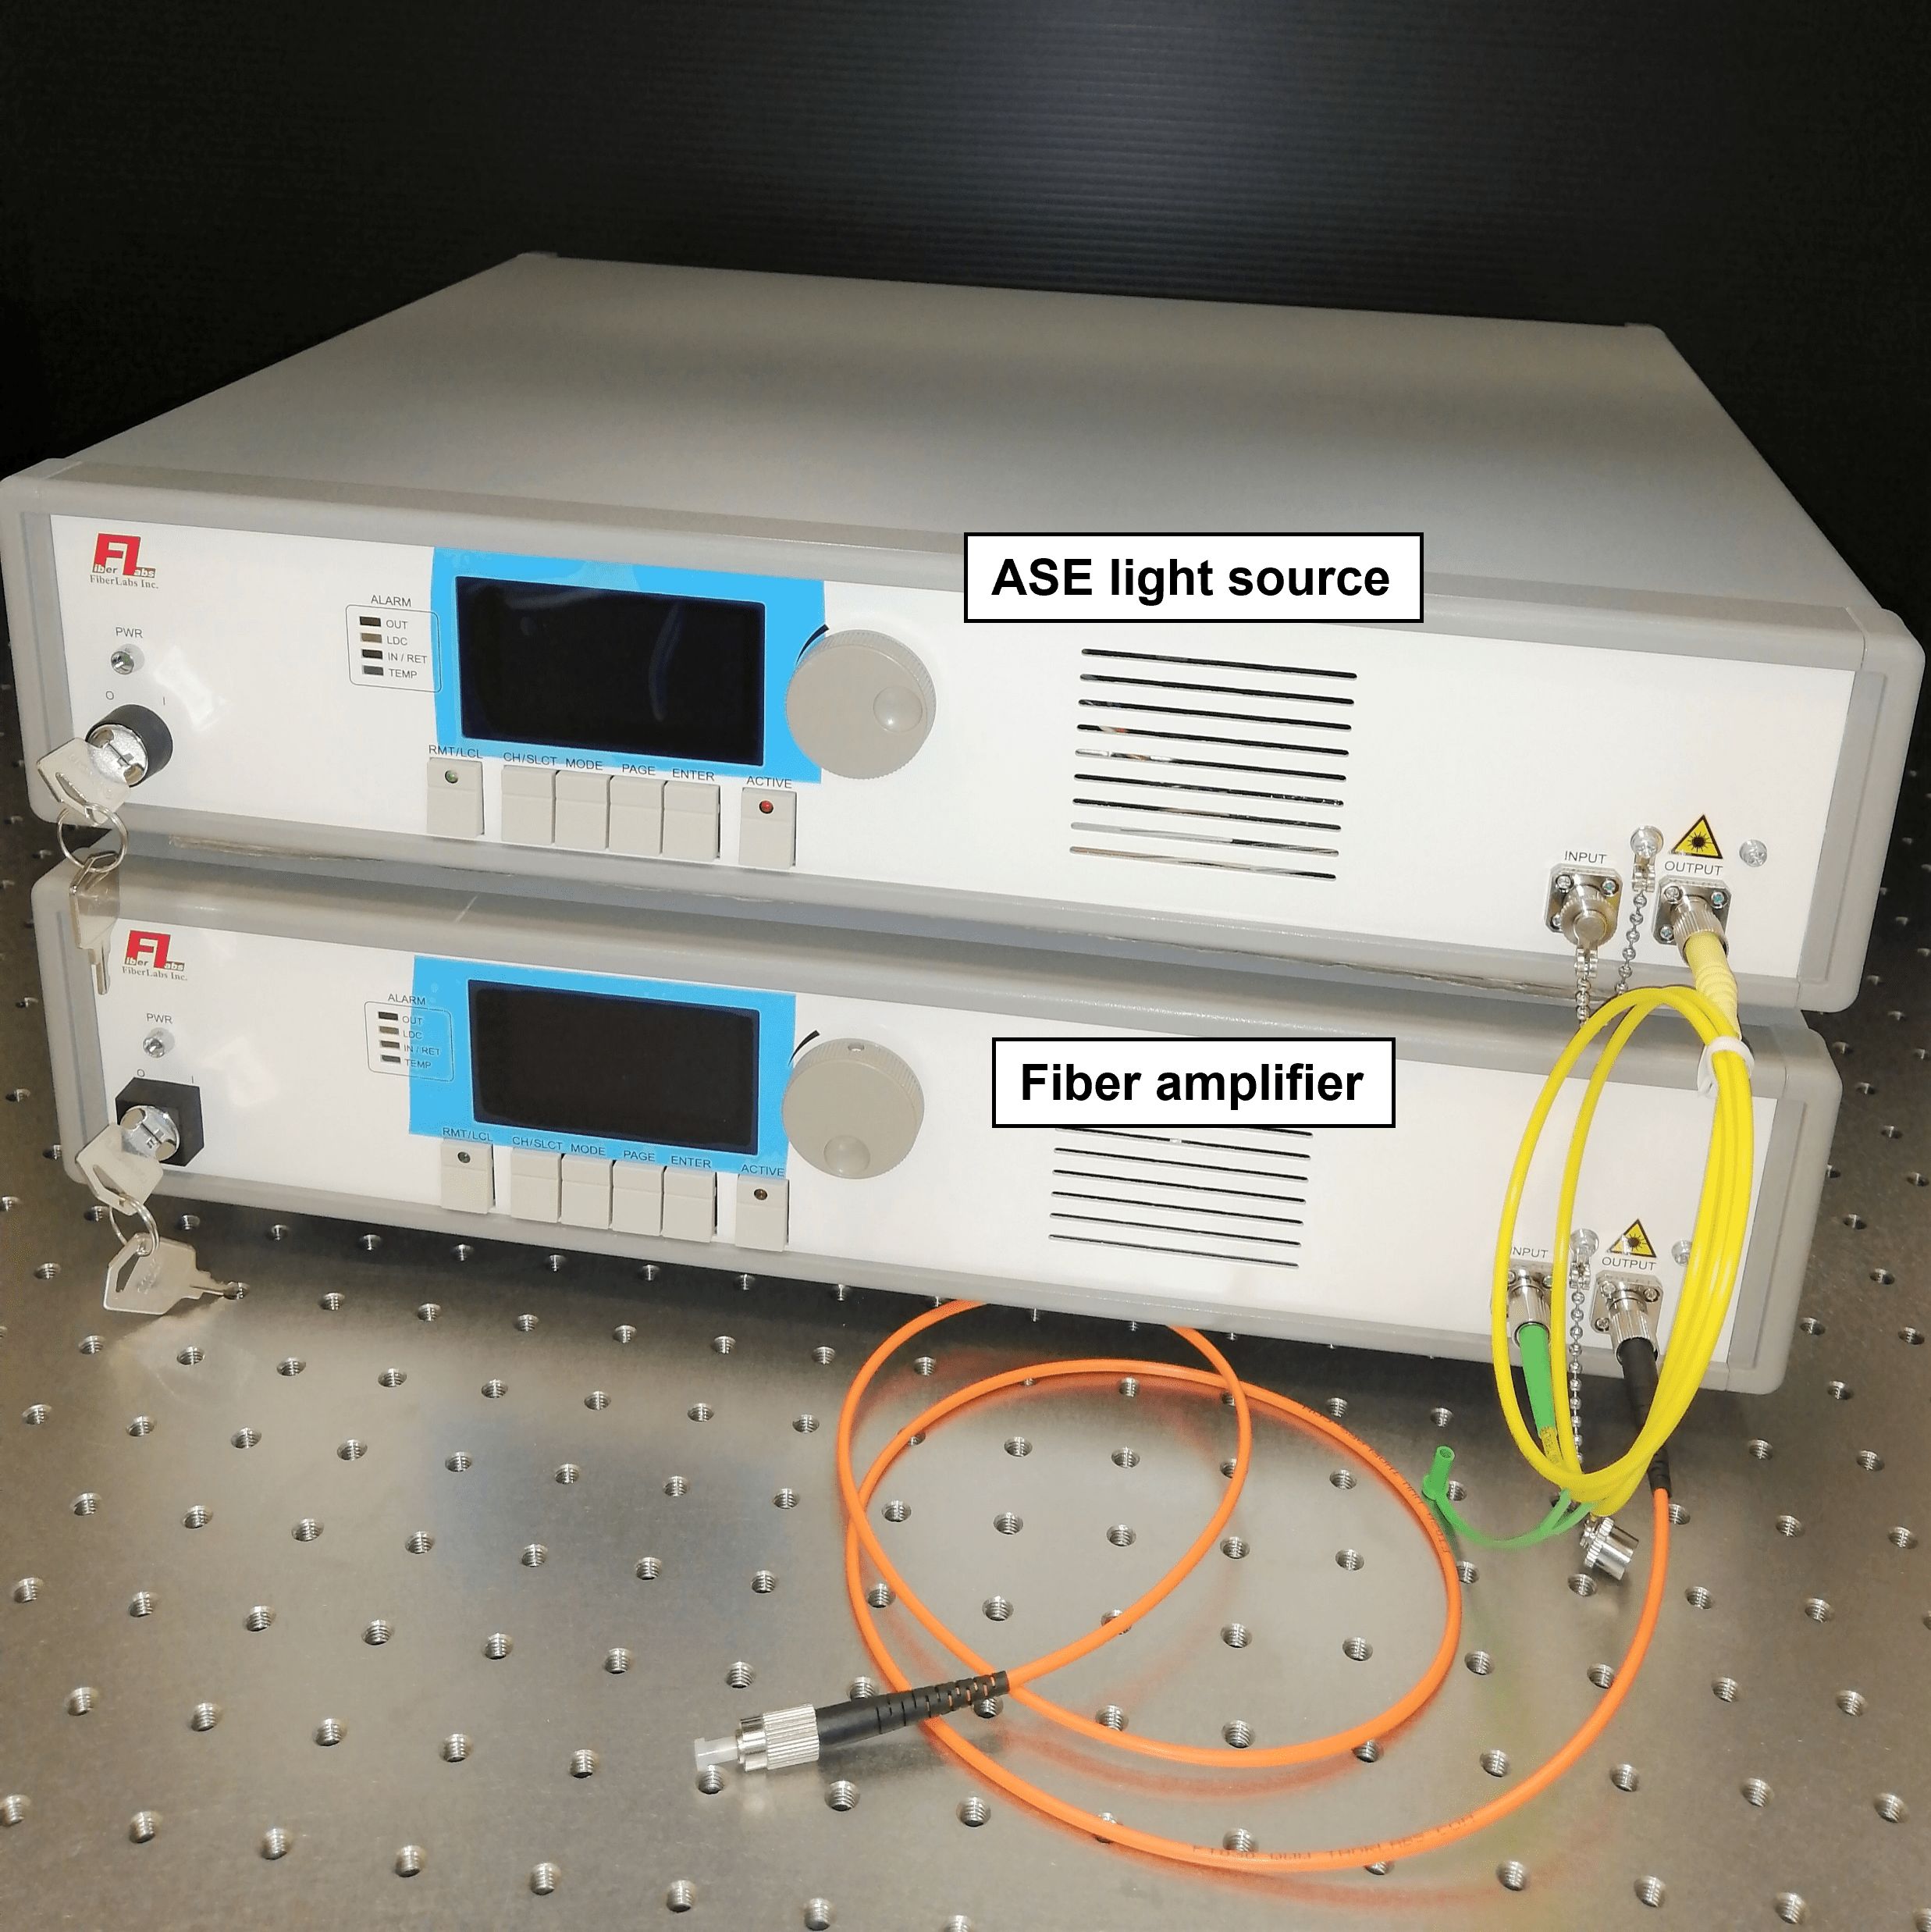
Figure 4: High-power ASE light source system (dimension 88 x 440 x 350 mm each)
The output power and the spectrum of the amplified ASE light source are shown in Figs. 5 and 6. After one-hour warm-up time, the output power stability was less than ±5% for 50 hours. Since the room temperature change was much smaller than in the case of the narrow-linewidth amplification, the output power stability was more stable.
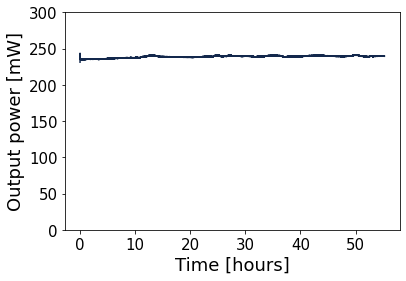
Figure 5: Temporal variation of the high power ASE light source at 805 nm
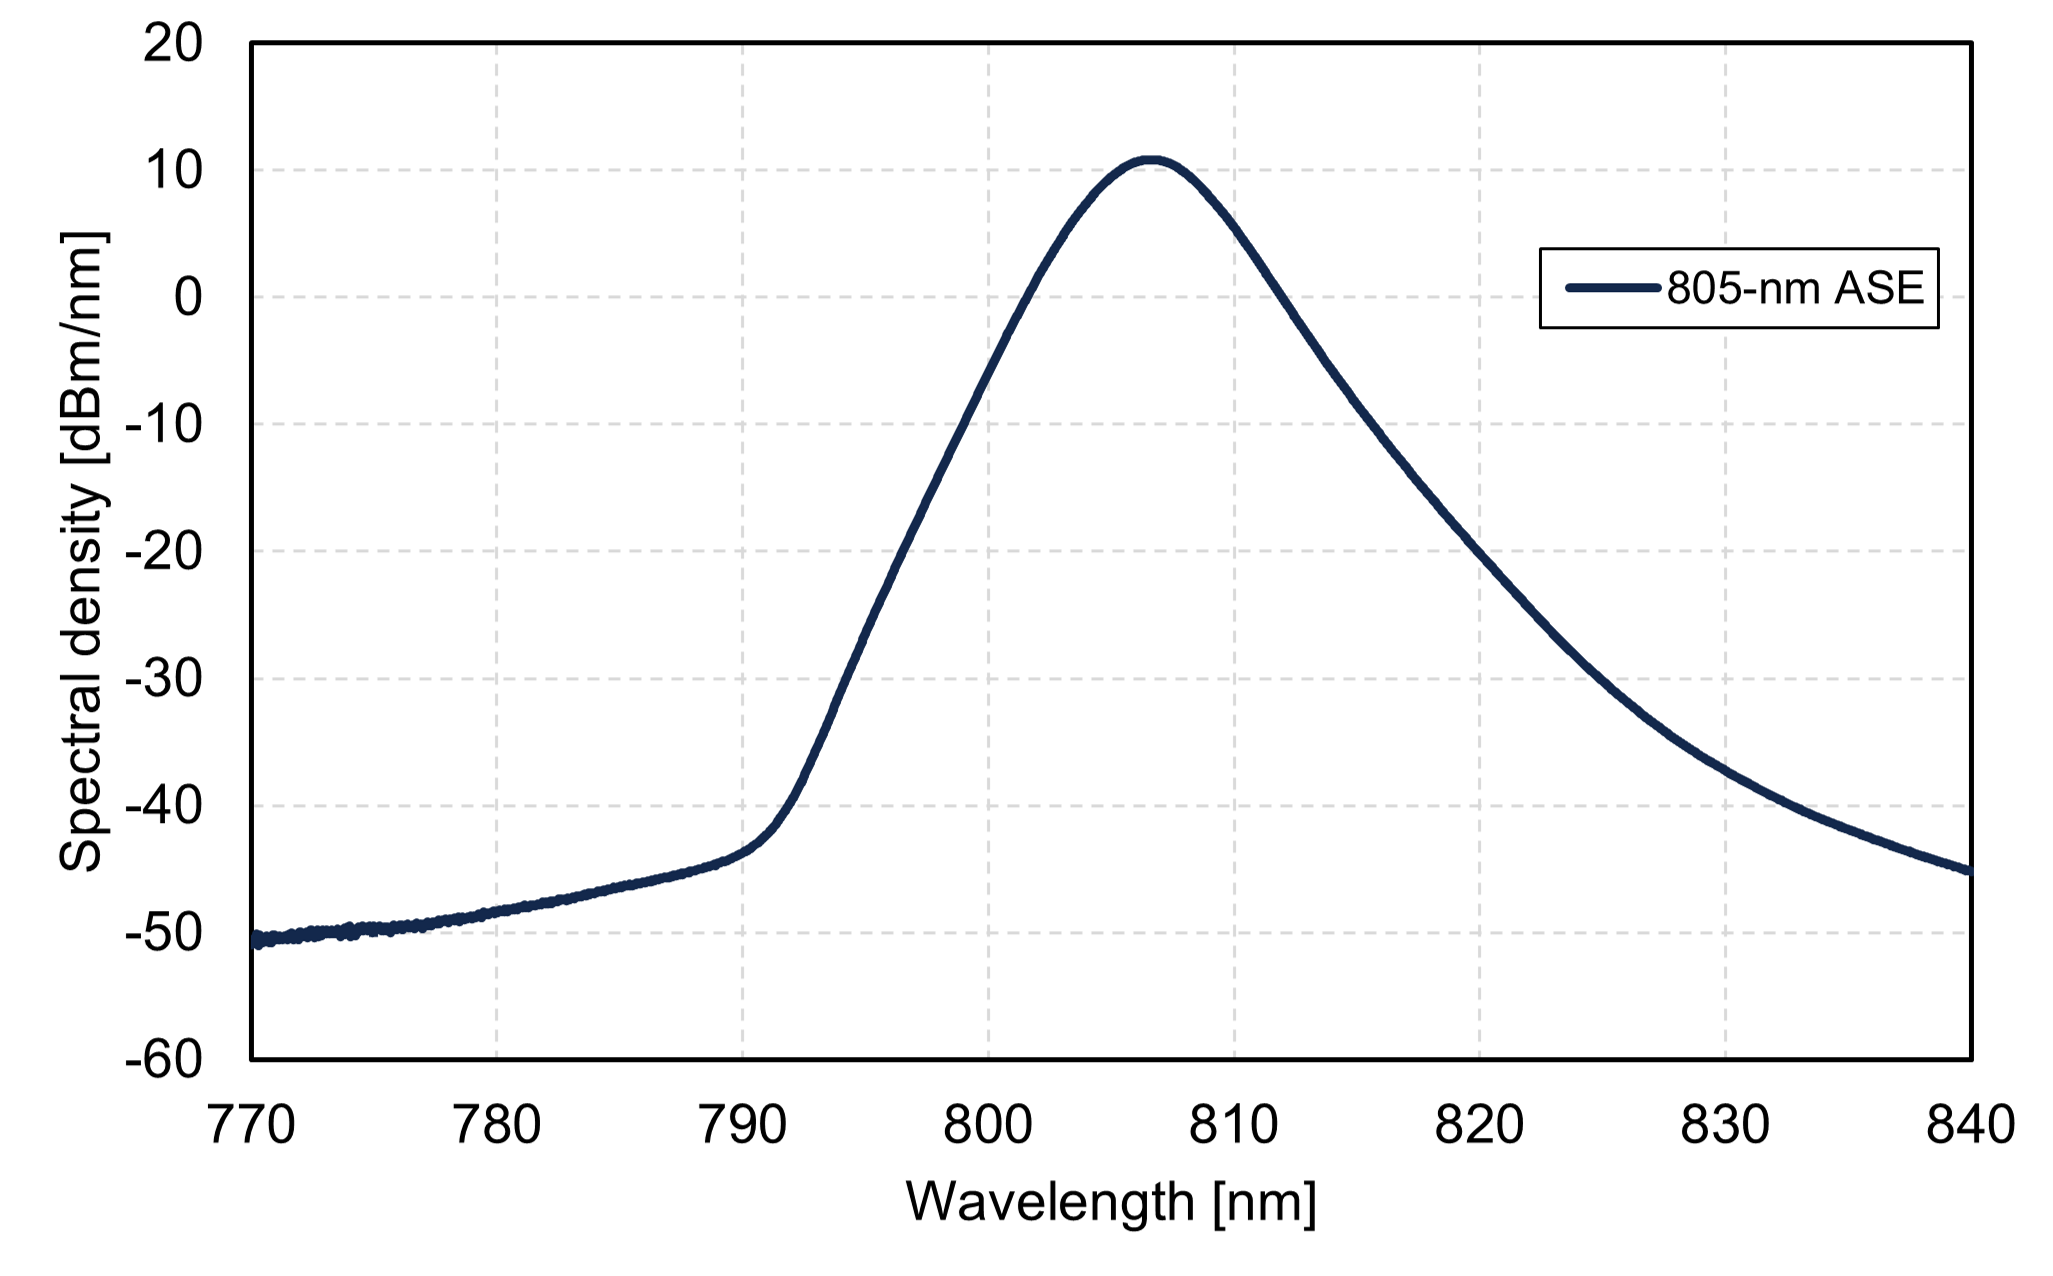
Figure 6: Output spectrum of high power 805-nm ASE light source.
Optical fiber amplifiers are very versatile platform for the creation of high-power light sources, as it can be combined with essentially any type of seed laser (e.g. narrow-linewidth, broadband, continuous-wave, pulsed…). By choosing a proper seed laser, it can be applied to various applications such as:
Currently the maximum output power from our amplifier system is 300 mW. We aim to produce more than one watt out of this platform by adding the third stage power amplifier. With an output power more than one watt, this platform can be used for a wide range of applications in biomedical and quantum science.
Furthermore, development of Polarization-Maintaining fiber amplifier is planned to pave the way for new applications that require linearly polarized output.
link 805-nm single-mode ASE light source
A demo unit of FiberLabs’ novel 805-nm single-mode ASE light source is now available for customer evaluation. This ASE source provides low-coherence 10-mW continuous-wave output from a single-mode fiber. Both ACC (Auto Current Control) and APC (Auto Power Control) operation is available to produce stable output power.
This ASE source has not been officially launched yet, and the final specifications are to be determined through interactions with potential customers. Actual customer feedback is critical for us, so please feel free to contact us if you are interested in testing this light source!

Figure 1: 805-nm ASE light source (dimension 88 x 440 x 350)
Output power and spectrum of the demo unit are shown in Fig.2 and Fig.3. We operated the unit in ACC mode for more than 50 hours, and the output power stability was less than ± 5% after one-hour warm-up time. We repeated the 50-hour continuous operation and did not observe any sign of power degradation.
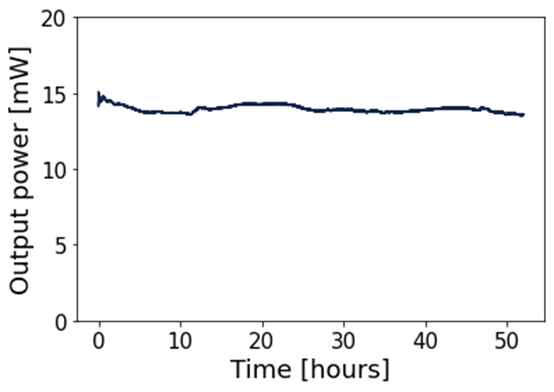
Figure 2: Temporal variation of output power at 805 nm.
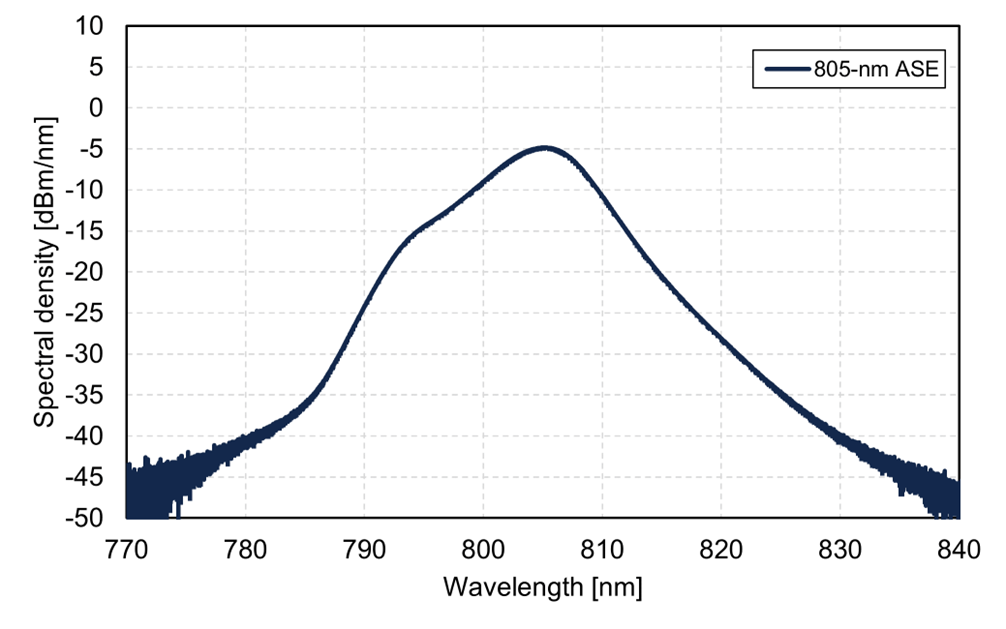
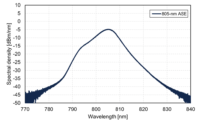
Figure 3: Output spectrum of 800-nm ASE light source.
This demonstration is part of our project on developing high power single-mode fiber amplifier platform at around 810 nm. We aim to produce more than one watt out of this platform, which is expected to be used in a range of applications such as biomedical and quantum science.
link O-band PDFA achieves 500-mW output
We have released high power O-band amplifier (+23 dBm (200 mW) PDFA FL-AMP8612-OB-23), and reported that it is able to achieve higher output power of > +26 dBm (> 400 mW) at around 1300 nm. This high-power O-band amplifier has potential to create new avenues of research and expand applications in optical communication, bio-imaging and other fields.
In this report, we inform that the high power PDFA has realized long-term stable operation over 100 hours with output power of 500 mW.
The internal configuration of the PDFA used in the test was slightly tuned from the AMP-FL8612-OB-23, though there are no differences on the component level. This tuning was made in order to produce a higher output power (500 mW at 1310 nm) with the same pump power as the OB-23. This allows us to conduct a high-power endurance test at 500 mW, using the same optical components.
A 40-mW seed light at 1310 nm from a DFB-LD was amplified by the high power PDFA, and the output signal was measured by a power meter.
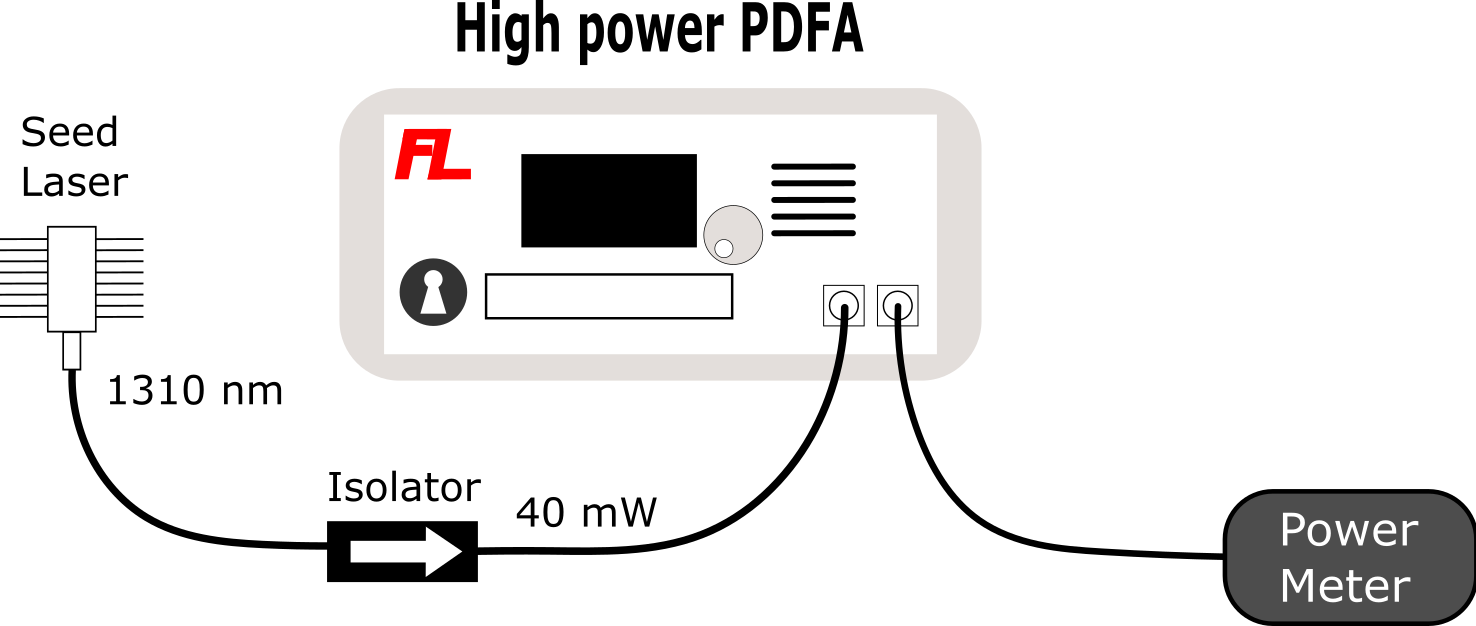
Figure 1: Schematic of test setup.
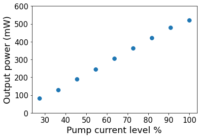
Figure 2 shows the output power evolution as a function of pump current normalized by the maximum available. Output power of more than 500 mW (27 dBm) was achieved, which was limited by available pump power. To the best of our knowledge, this is the highest output power from rare-earth doped fiber light sources at 1310 nm. Also, further power scaling would be realized by using a more powerful pumping source
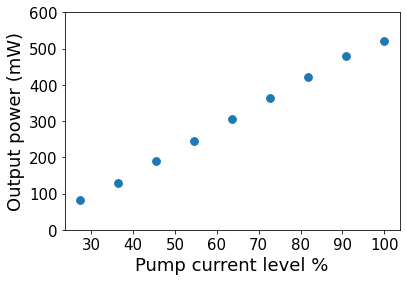
Figure 2: Output power evolution at 1310 nm.
Figure 2 shows a long-term temporal variation of the output power from the PDFA, showing the 500-mW output level was maintained over 100 hours. We repeated this test several times and no sign of degradation was observed.

Figure 3: Temporal variation of output power from PDFA.
We plan to test high power operation at other signal wavelengths such as 1290 nm and 1330 nm, which is significantly important for 400GBASE-LR8 and CWDM4. We believe that our high power PDFA opens new opportunities in optical communication technology, biological science, and frequency conversion.
FiberLabs offers the following products related to this article. Please visit these pages if you are interested in this article.
link Performance of 23-dBm PDFA for LWDM8 and CWDM4 wavelength range
Now the prototype shown in this post has been released as AMP-FL8612-OB-23. Please refer to the following link for product details.
O-band amplifier (PDFA, bench-top type)
This post is kept here as a record of our R&D activity.
In our previous post we did the first preview of our +23 dBm (200 mW) PDFA FL-AMP8612-OB prototype. The output from the PDFA exceeded +23 dBm with a sufficient margin. The measurement, however, was done only at one wavelength (1310 nm).
In this post we show more details of the amplifier characteristics – gain and noise figure at the 400GBASE-LR8 and CWDM4 wavelength ranges. These two wavelength ranges are of paramount importance for test and measurement of the next-gen Ethernet transceivers.
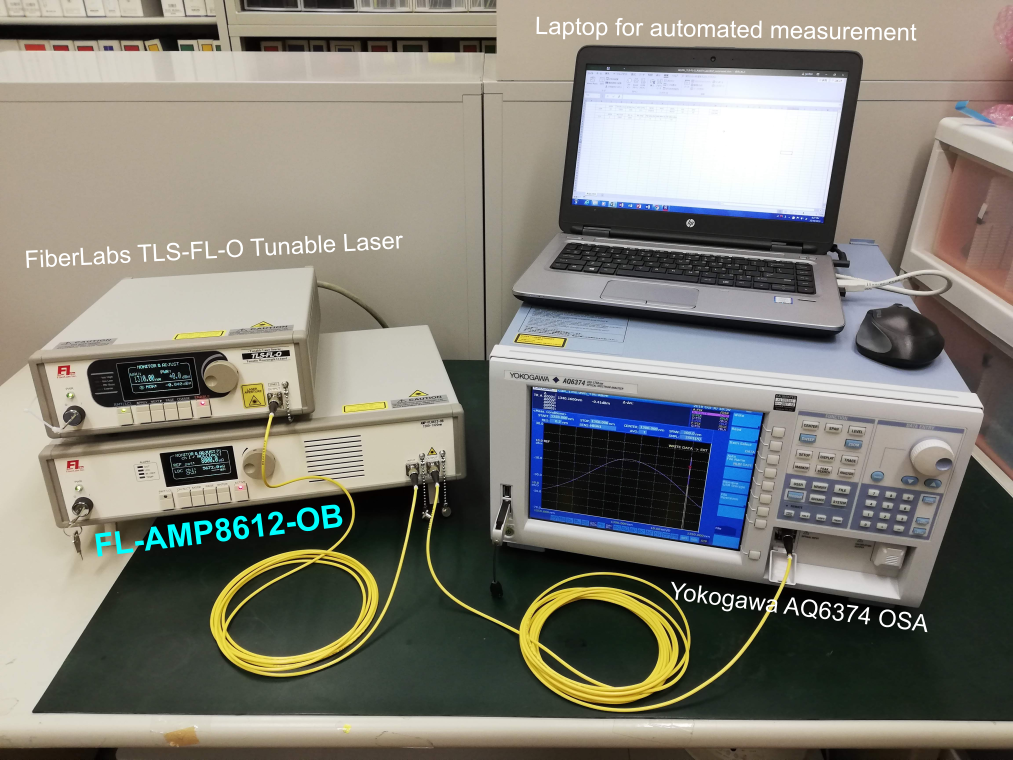
Figure 1: Test setup.
The setup of the experiment is quite similar as the previous post. The only difference is that the measurement is controlled by a laptop PC for automated wavelength scanning in the O-band. The pump power was fixed to a level such that the output from the PDFA becomes +23 dBm, when the input is 0 dBm at 1310 nm. The measured gain spectrum and NF are shown in below.
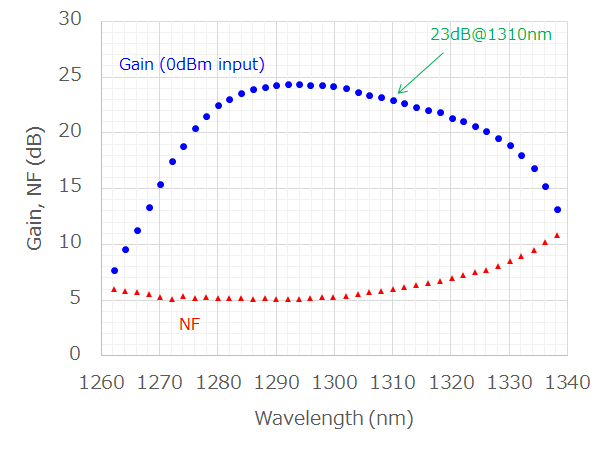
Figure 2: Gain and NF.
The two figures below show the gain curve, same as above, but now the LR8 and CWDM4 wavelength range (including wavelength tolerance) are marked. This shows that the amplifier may readily be used for transceiver testing, such as receiver stress testing or eye-pattern monitoring.
We have previously shown that the addition of a PDFA hardly add transmission penalty for 100GBASE-LR4 transmission in the booster amplifier configuration (see our previous post). As the configuration of this prototype is quite similar to that used in the previous post, we believe this prototype should hardly add transmission penalty, too.
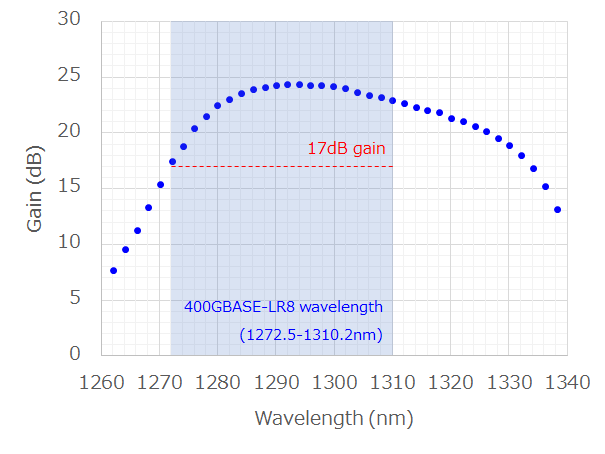
Figure 3: 17dB gain over LR8 range.
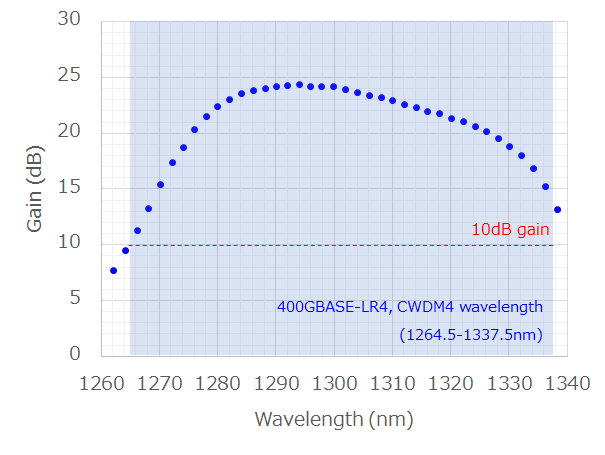
Figure 4: 10dB gain over CWDM4 range.
All the results shown in the above were taken at 80% of full pump power. This is because some amount of operation margin is always needed as a commercial product. Here we show the gain spectrum measured at full pump power, just to demonstrate the potential of further power scaling.
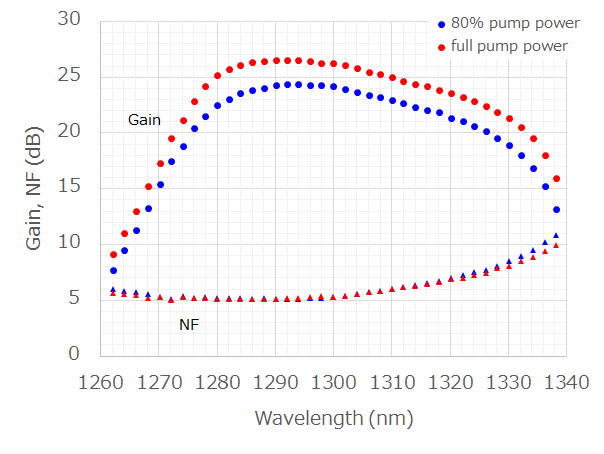
Figure 5: Potential for further power scaling.
It is seen that the output power nearly reaches +27 dBm (500 mW) at 1290-1300 nm region. This result indicates, by using a more powerful pump source, a half-watt amplifier could be commercially feasible in the near future.
If you are a potential customer interested in using this amplifier, we appreciate your input in order to make our product better. Please send us your requests via request sheet!
FiberLabs offers the following products related to this article. Please visit these pages if you are interested in this article.
link Unvailing 23-dBm O-band PDFA prototype
Now the prototype shown in this post has been released as AMP-FL8612-OB-23. Please refer to the following link for product details.
O-band amplifier (PDFA, bench-top type)
This post is kept here as a record of our R&D activity.
FiberLabs’ PDFAs have been a popular choice for amplifying 100G/400G Ethernet signal in the O-band, particularly useful for transceiver testing (see example), as well as network monitoring and reach extension. Currently our high-end model is FL-AMP8611-OB-20, and we always hear strong demands for a higher output power.
We are now ready to unvail a “prototype” of our higher-power PDFA FL-AMP8612-OB, targeting to double the output power. This post provides basic amplification characteristics of the prototype.
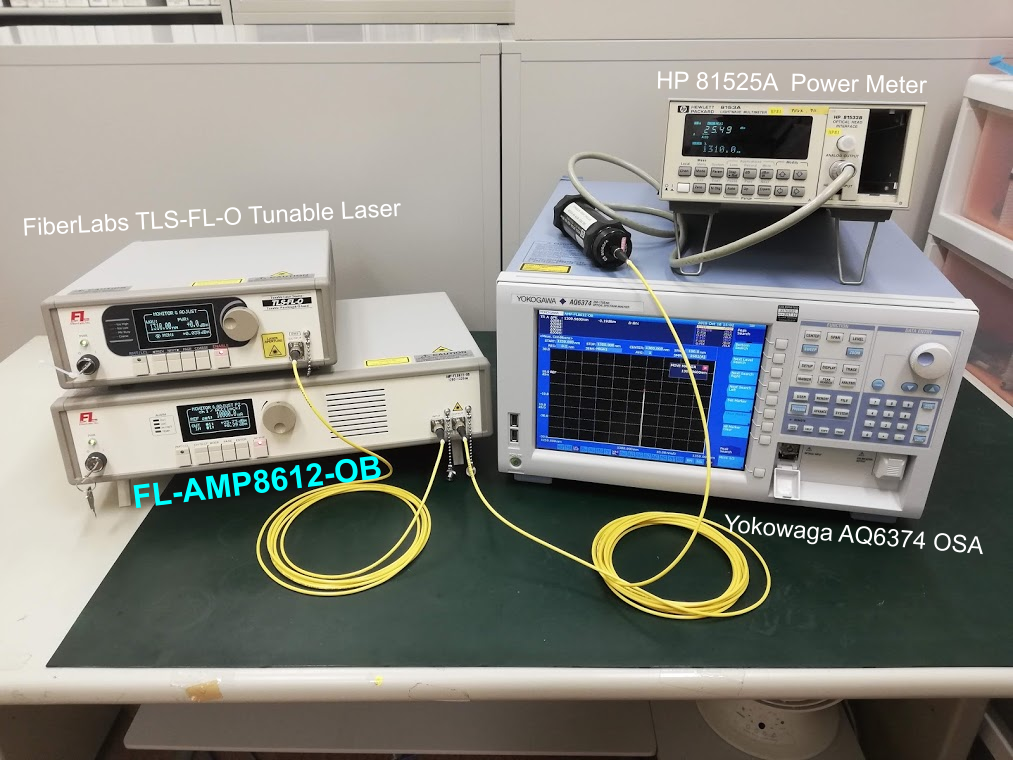
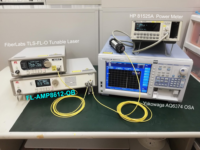
Figure 1: Test setup.
The setup of the experiment is shown in Fig. 1. The input signal (0 dBm at 1310 nm) was provided by FiberLabs TLS-FL-O tunable laser. The input signal was amplified in the prototype amplifier, and the output signal was measured by a power meter and optical spectrum analyzer. The size of the amplifier chassis is the same as FL-AMP8611-OB-20.
The graph shown in Fig. 2 is the measured output power with regard to the pump current (normalized to maximum available). This prototype amplifier provided maxium 350 mW (>25 dBm), which is limited by available pump power.
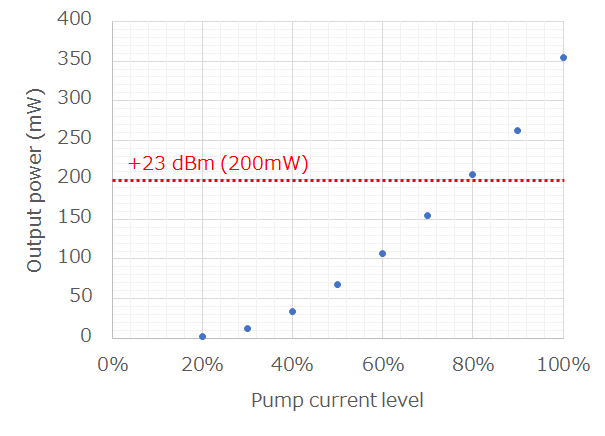
Figure 2: Output power at 1310 nm.
The output spectra (at +23- and +25-dBm output power) are shown in Figs. 3 and 4. The amplifier provided a clean spectrum with no onset of unstable behavior.
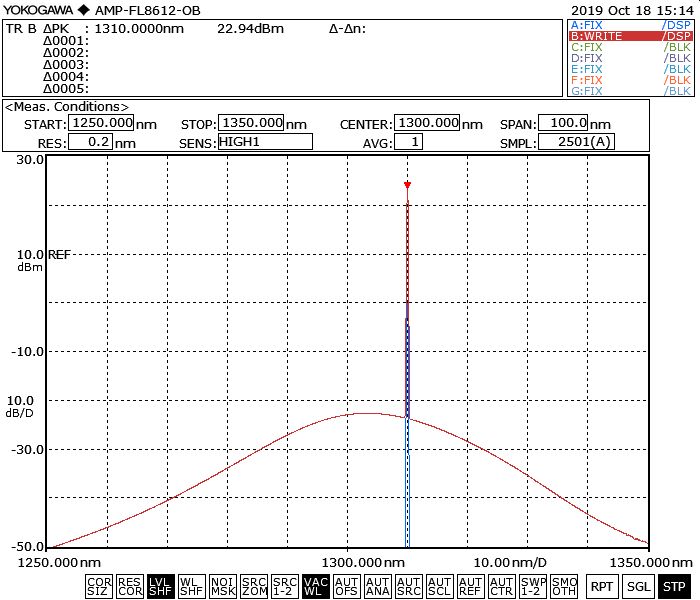
Figure 3: Output spectrum at +23-dBm output.

Figure 4: Output spectrum at +25-dBm output.
We are excited to get an output power much higher than our 23-dBm target, however, this is a preliminary result and additional tests should be done before product release.
We plan to start more thorough testing – for example, gain measurement at 400GBASE-LR8/ER8 and CWDM4 wavelengths. This amplifier should provide a higher gain at these wavelengths, and thus it may allow us to produce a flat-gain O-band amplifier with the incorporation of a gain-flattening filter inside.
If you are a potential customer interested in using this amplifier, we appreciate your input in order to make our product better. Please send us your requests via request sheet!
FiberLabs offers the following products related to this article. Please visit these pages if you are interested in this article.
link Development of elliptical-core PM ZBLAN fiber
This post introduces polarization-maintenance ability of an elliptical-core PM ZBLAN fiber that we manufactured recently.
Polarization-Maintaining Fiber (PMF) is used when the maintenance of linear polarization is critical as light propagates through an optical fiber. The most commonly used one is a PMF by internal stress (see Figure 1), where two stress-applying parts positioned on both sides of the core produce thermally induced birefringence.
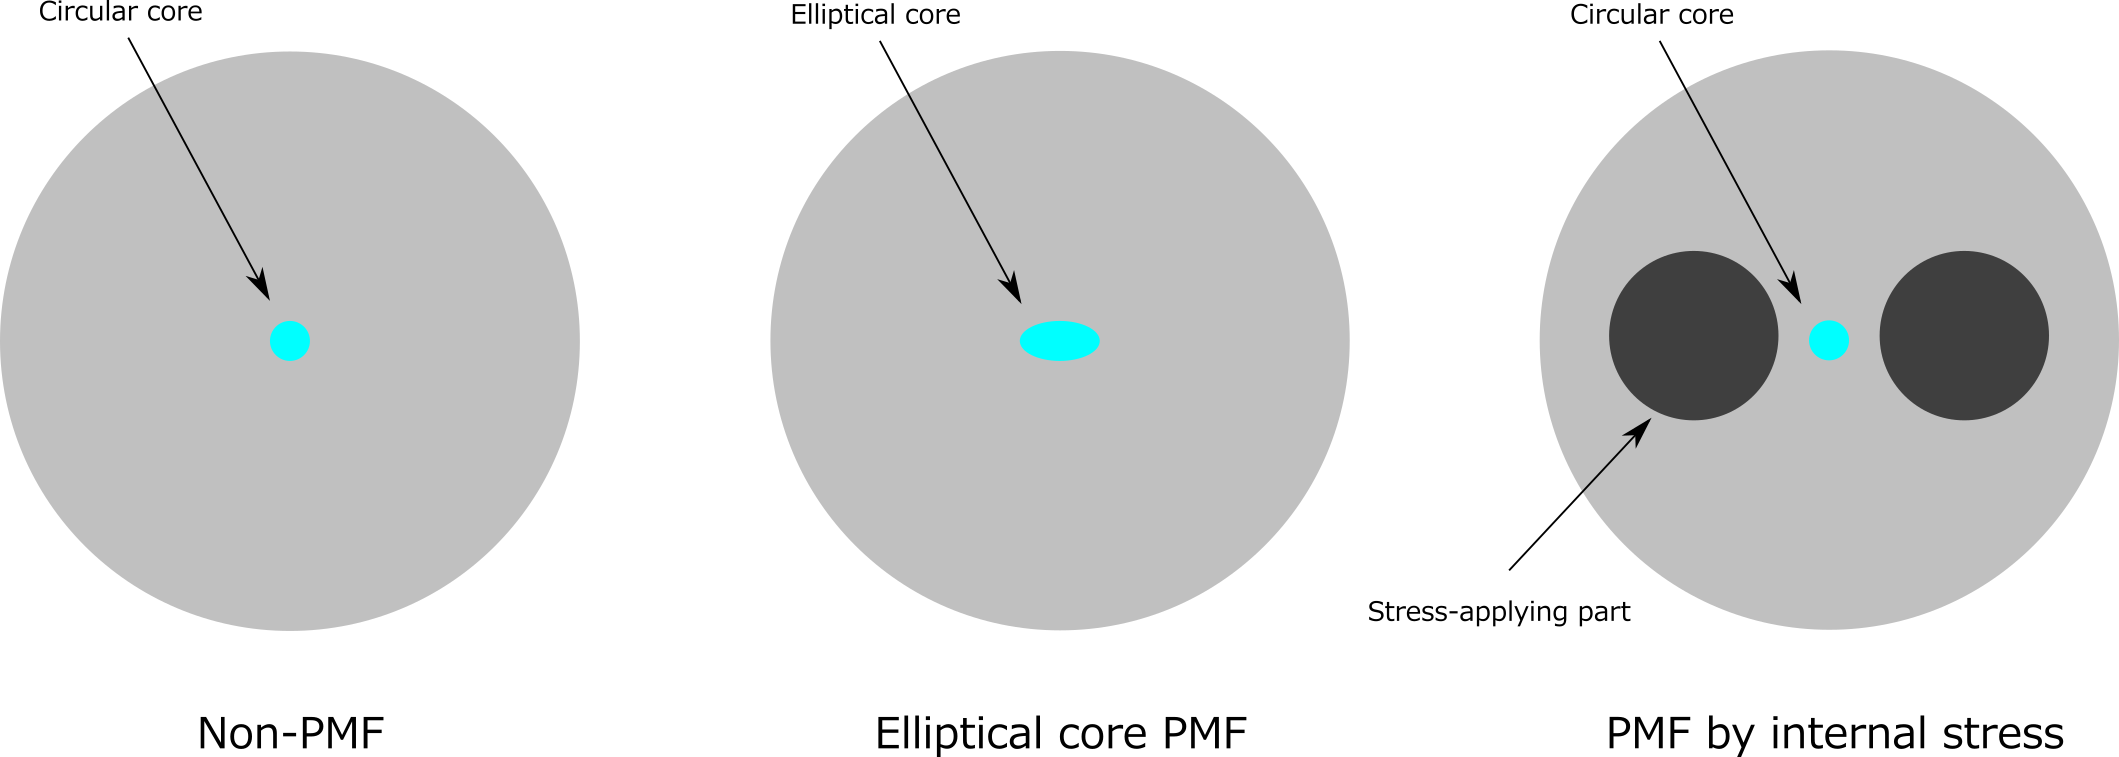
Figure 1: Non-PM fiber and different types of PM fibers.
Alternatively, a PM fiber can be made by making the shape of the core elliptical. The manufacturing process does not require drilling two holes (for inserting stress-applying parts) in the glass, and thus is much simpler. This feature is beneficial for production for ZBLAN-based PM fiber, as mechanical processing of ZBLAN glass is much more difficult than that of silica glass.
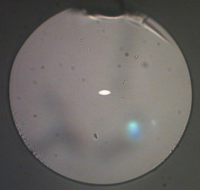
The cross section of our elliptical-core ZBLAN fiber is shown in Figure 2. The size of the elliptical core is 8.2 µm × 3.2 µm. The core numerical aperture is 0.2.

Figure 2: Cross section of elliptical-core PM ZBLAN fiber.
The ability of maintaining the polarization state can be quantified by polarization crosstalk (see Figure 3 for schematic and definition). We measured the polarization crosstalk of our PM ZBLAN fiber using an experimental setup shown in Figure 4. An output from an ASE source (wavelength: 1550 nm) was polarized by a polarizer at the input, and the polarization state was aligned to the long axis of the ZBLAN fiber. The light was then launched to the core of a three-meter-length PM ZBLAN fiber, and as the light propagated along the fiber, a tiny portion of the light coupled to the short axis by polarization coupling. The degree of polarization coupling was quantified by the follwoing three steps: (1) placing another polarizer (called analyzer) at the output, (2) rotating the polarizer, and (3) measuring the max and minimum transmitted power (i.e, measuring P0 and P1 in Figure 3).
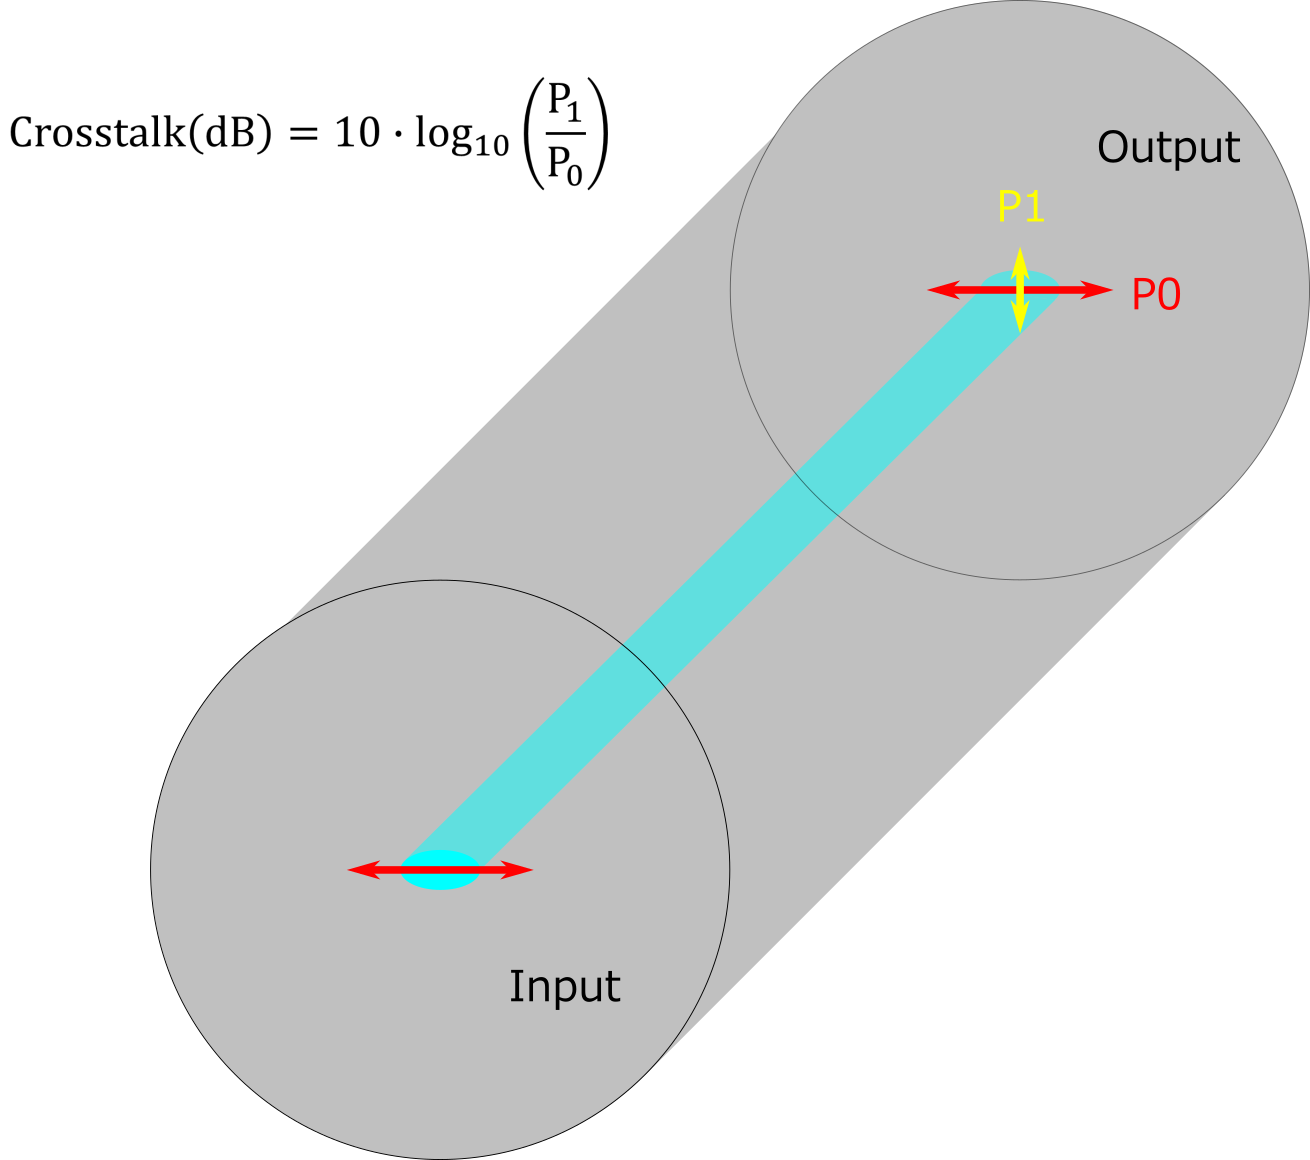
Figure 3: Schematic and definition of polarization crosstalk.
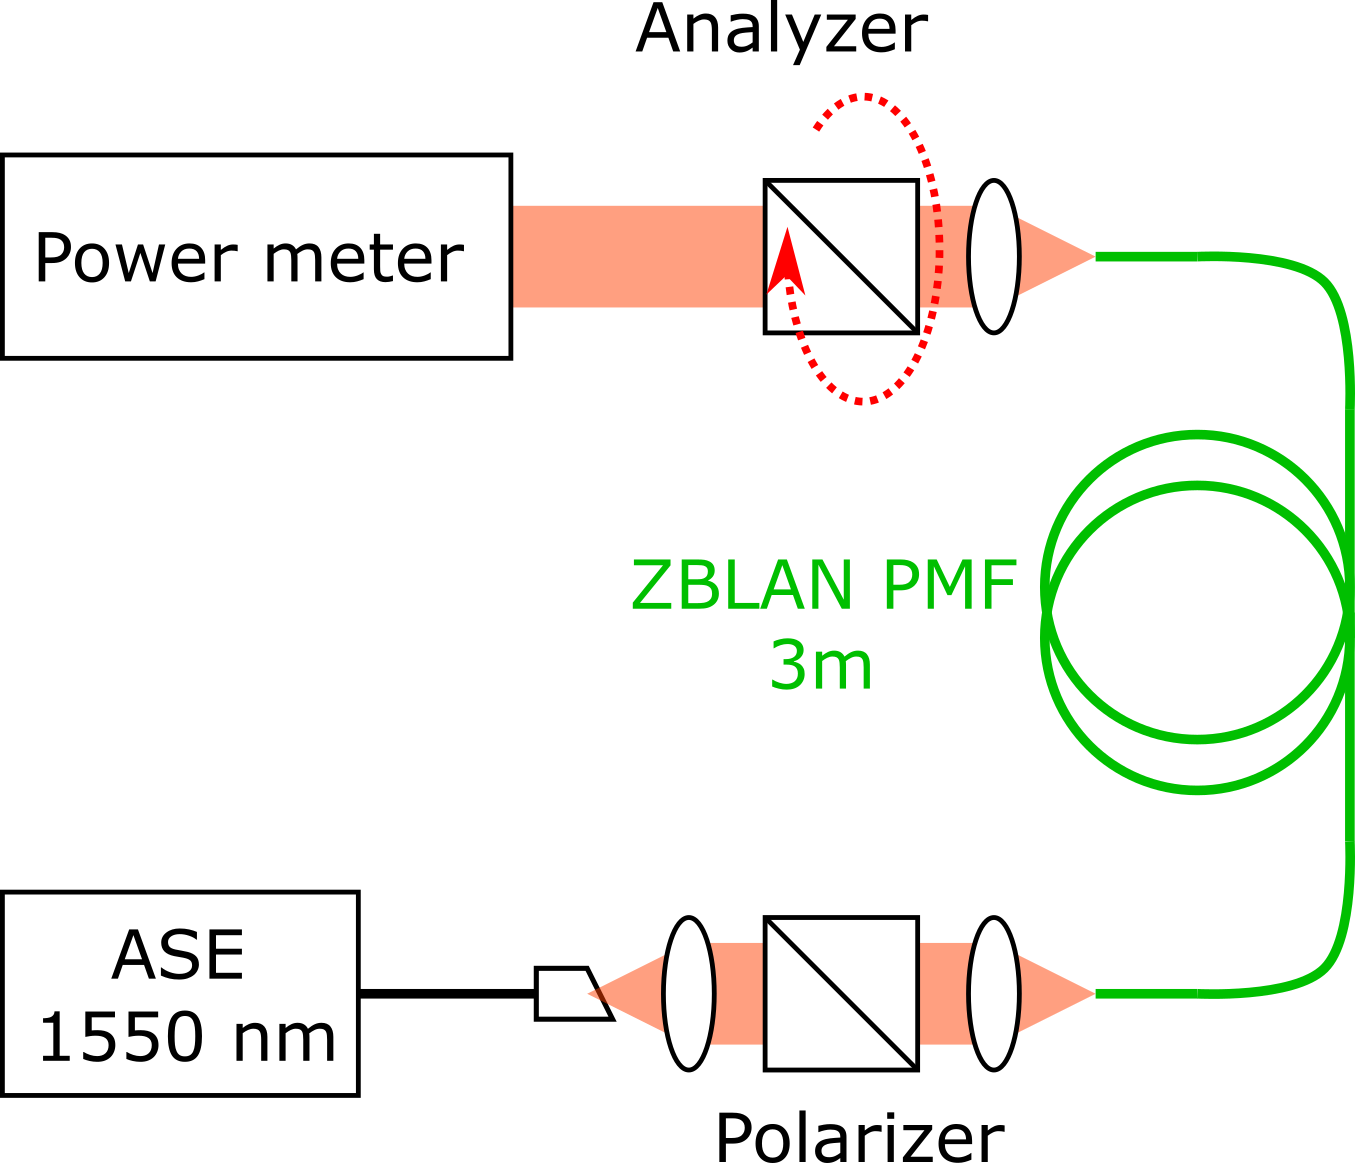
Figure 4: Experimental setup.
Figure 5 displays the measured transmitted power after the analyzer. The oscillatory behavior with a period of 180 degrees clearly shows that the linear polarization was maintained in the fiber. The measured polarization crosstalk was less than -15 dB, showing that this fiber possesses sufficient capability as a PM fiber.
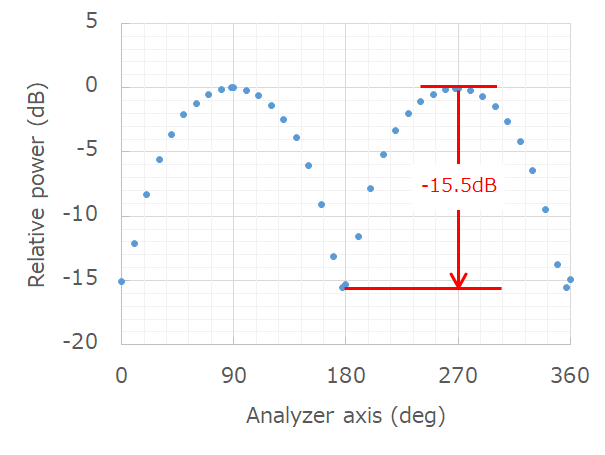
Figure 5: Measured polarization crosstalk.
One main interest of such a ZBLAN fiber would be the construction of polarized fiber lasers and amplifiers, as ZBLAN fibers are inherently superior to silica fibers in terms of a wider range of emission wavelength from visible to the mid-IR.
In addition to passive (non-rare-earth-doped) PM ZBLAN fibers, we have already manufactured some thulium-doped elliptical core fibers and have them in stock. So please feel free to contact us if you are interested in our stock fibers, as well as a custom draw using other rare-earth dopants of your interest.
FiberLabs offers the following products related to this article. Please visit these pages if you are interested in this article.